
A trendline may look like a simple line on a chart, but it can reveal valuable insights about market behavior. As one of the foundations of technical analysis, trendlines help traders recognize trends, identify support and resistance, and anticipate potential breakout or reversal opportunities.
Whether you're just starting your trading journey or looking to refine your trendline strategy, learning how to draw trendlines correctly is an essential skill. This ultimate guide walks you through everything you need to know, from the basics of trendlines to practical techniques for using them with confidence.
1. What Is a Trendline in Trading?
Every trader needs a reliable way to understand where the market is heading, and a trendline is one of the easiest tools to achieve that. Drawn across important turning points on a chart, trendlines reveal the path of price movement and create dynamic support and resistance instead of relying on a single price level.
The real value of trendlines lies in their ability to provide a clear picture of the current market condition. Rather than reacting to every candle, traders can stay focused on the dominant trend and avoid unnecessary trades.
As price approaches a trendline, it often creates valuable entry and exit opportunities. A bounce may confirm trend continuation, while a break can signal that buying or selling pressure is shifting.
For this reason, trendlines are more than visual guides. They are practical tools for planning trades, managing risk, and making more confident trading decisions in changing market conditions.
2. Types of Trendlines Every Trader Should Know
Not all trendlines serve the same purpose. Depending on how price moves, traders generally use three types of trendlines: uptrend lines, downtrend lines, and sideways (horizontal) trendlines. Each one reflects a different market environment and helps traders identify where price is likely to react. Learning to distinguish these trendlines is the first step toward understanding market structure and making more informed trading decisions.
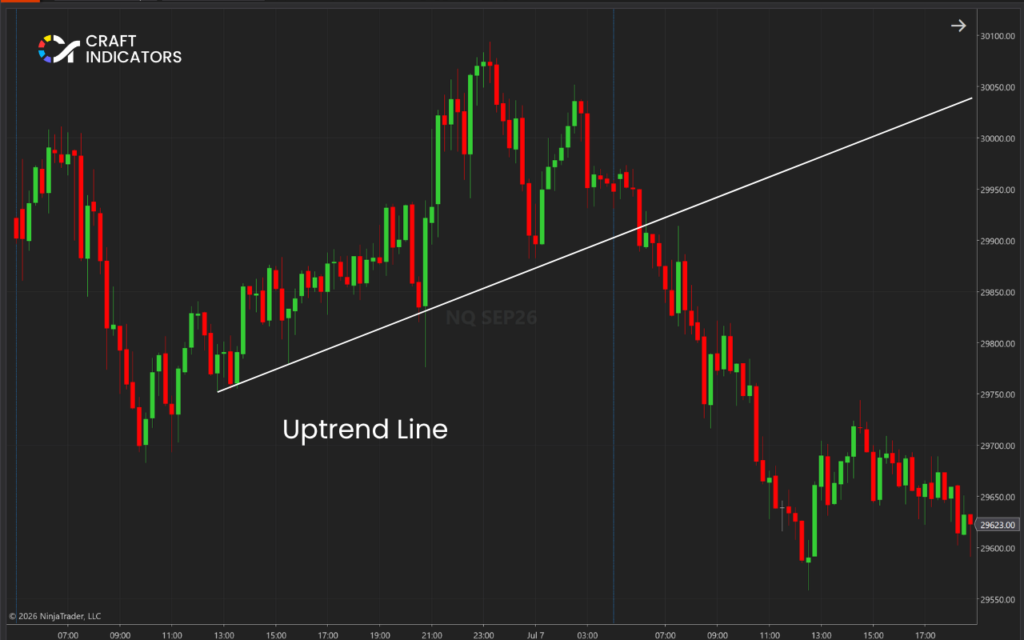
An uptrend line is drawn by connecting a series of higher swing lows, showing that buyers continue to enter the market at higher prices. As the trend develops, the line acts as dynamic support where price often retraces before resuming its upward move.
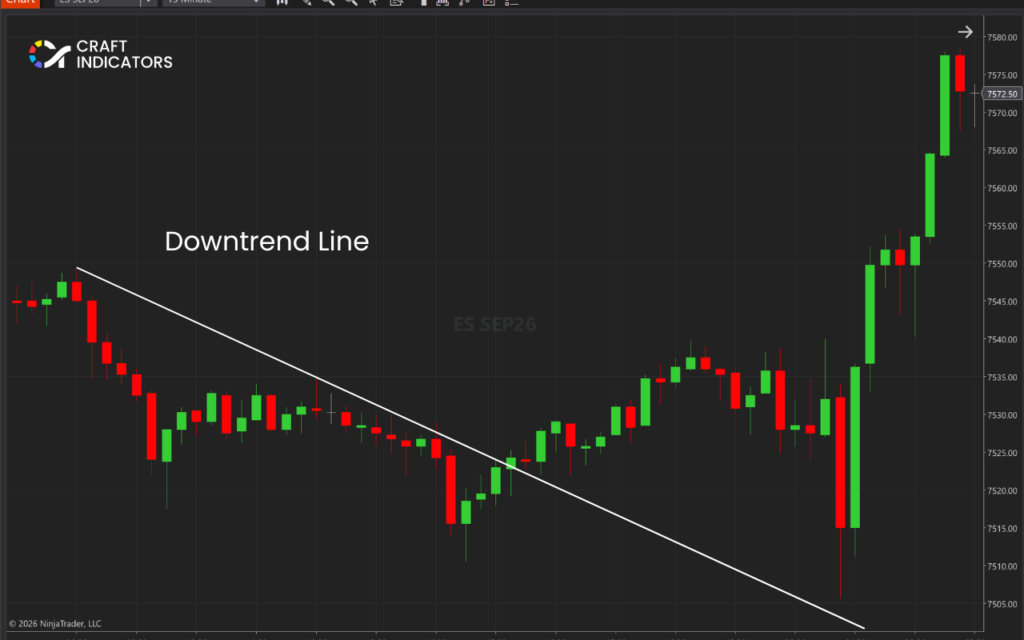
Conversely, a downtrend line connects lower swing highs, indicating persistent selling pressure. It functions as dynamic resistance and helps traders recognize potential selling opportunities or bearish trend continuation.
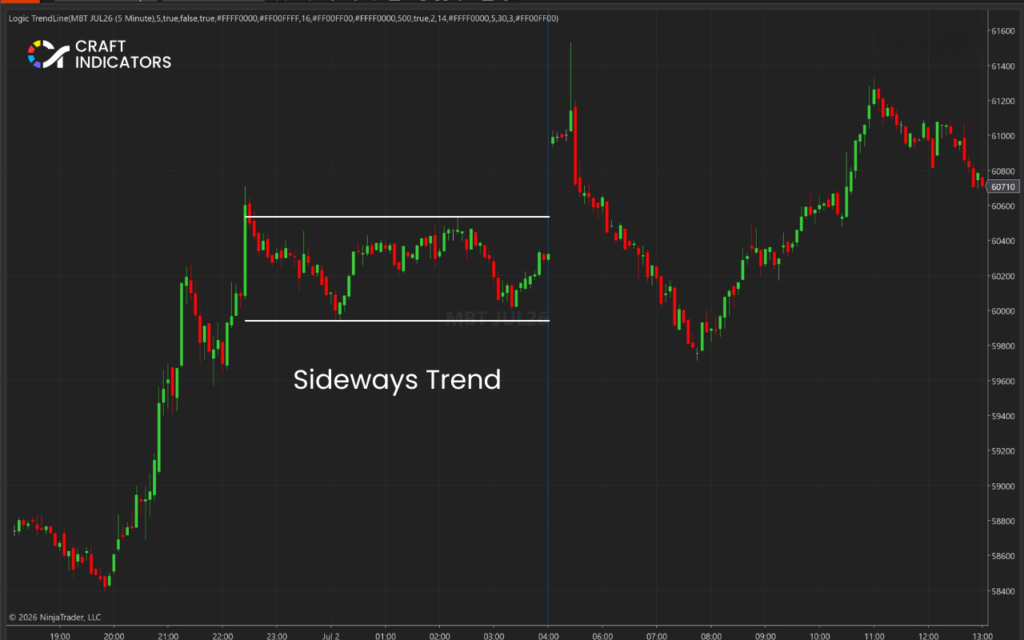
When the market lacks a clear direction, traders rely on a sideways (horizontal) trendline. Instead of following a rising or falling slope, this trendline connects equal highs or equal lows to highlight consolidation. During these periods, neither buyers nor sellers dominate the market, making horizontal support and resistance valuable for identifying range-bound trading opportunities and preparing for eventual breakouts.
3. How to Draw Trendlines
Before drawing a trendline, evaluate the overall market structure. Determine whether the price is trending or ranging by examining the sequence of swing highs and swing lows. An uptrend forms higher highs and higher lows, while a downtrend creates lower highs and lower lows. If the market repeatedly forms equal highs or lows without a clear direction, a horizontal support or resistance level is usually more appropriate than a trendline.
Step 1: Find Significant Swing Points.
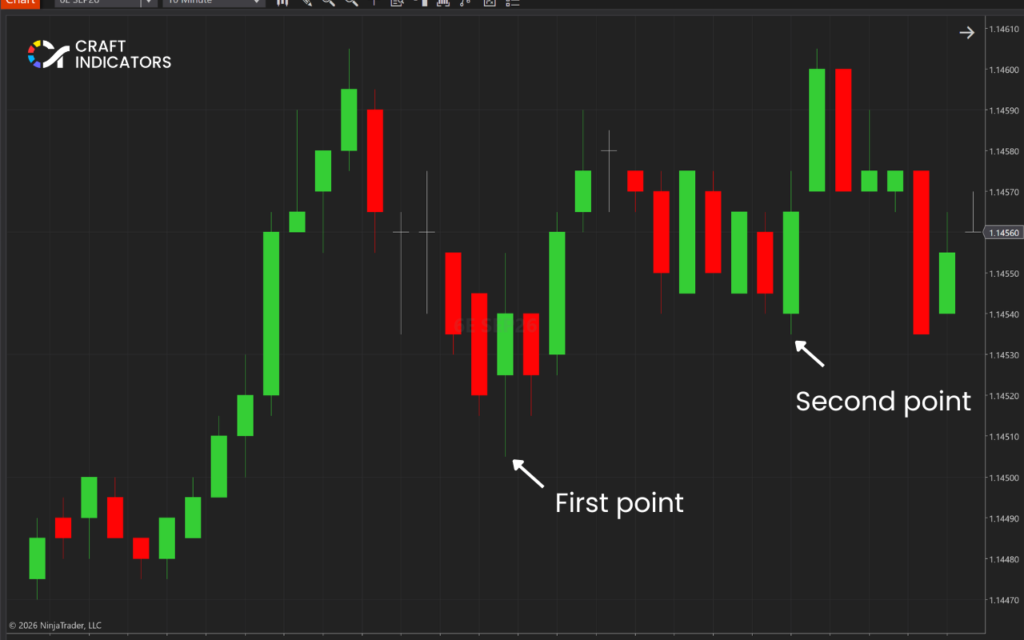
Start by locating major turning points on the chart, not every minor price fluctuation. Significant swing highs and swing lows represent areas where buying or selling pressure clearly shifted. The more obvious these pivots are, the more meaningful the resulting trendline will be.
Step 2: Connect at Least Two Valid Touches.
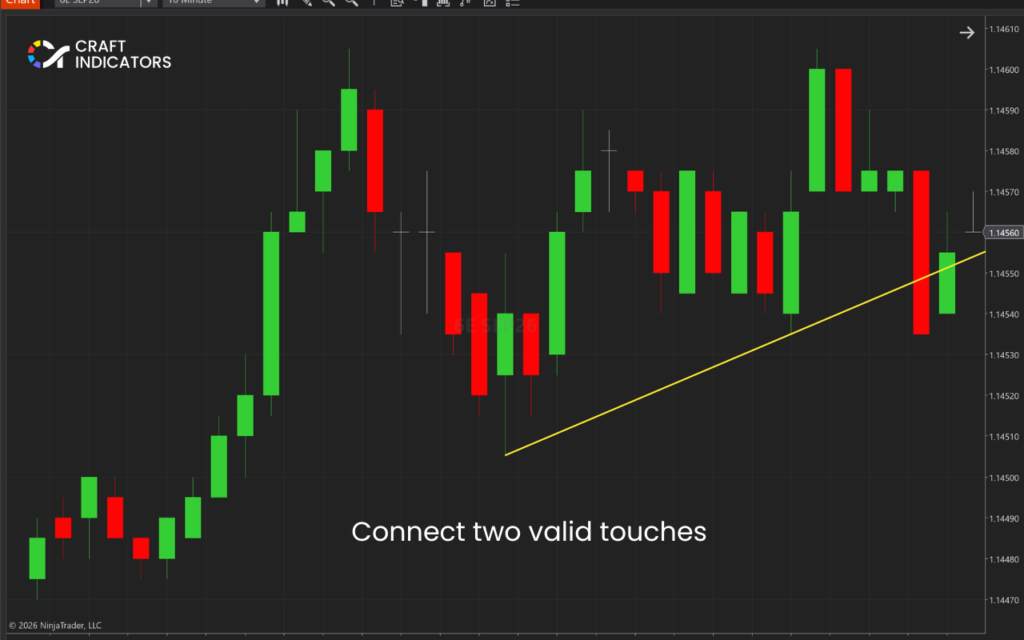
Draw a straight line that connects two or more important swing points. In an uptrend, connect the swing lows; in a downtrend, connect the swing highs. The line should fit naturally along the market structure without forcing it through candles simply to create more touches.
Step 3: Wait for the Third Touch.
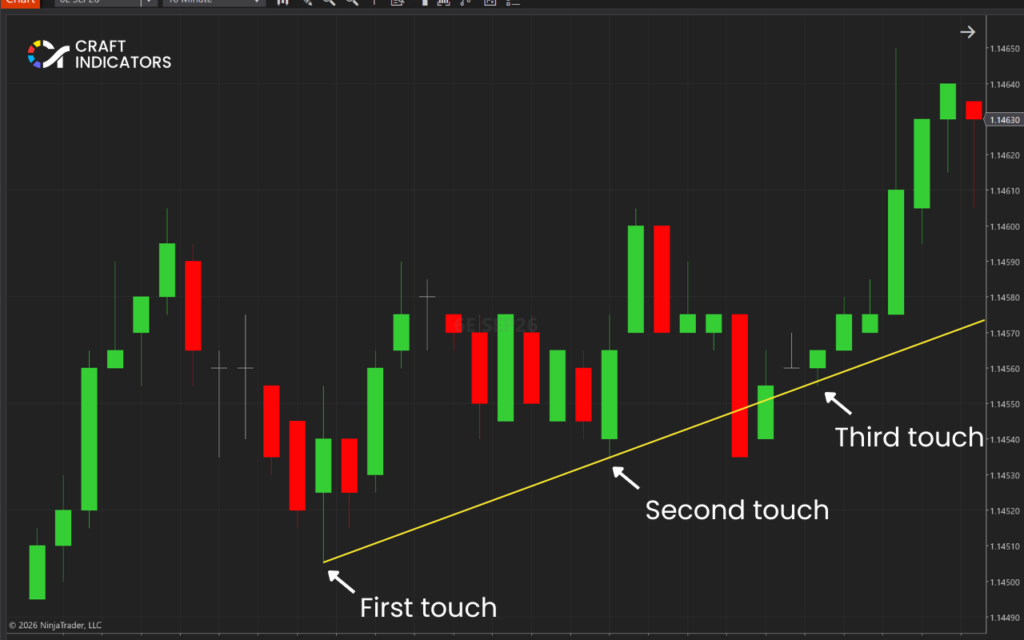
Although two points define a line, a third reaction validates it. When price respects the trendline for the third time, it confirms that other market participants recognize the same level, increasing the likelihood that it will continue acting as dynamic support or resistance.
Step 4: Extend the Trendline Forward.
Once the trendline is validated, project it into future price action. An extended trendline allows traders to anticipate where pullbacks, breakouts, or reversals may occur, making it a valuable tool for planning trades before price reaches the level.
Step 5: Monitor Future Price Reactions.
A trendline should never be considered permanent. Continue observing how price behaves each time it approaches the line. Strong bounces often confirm the existing trend, while repeated failures or decisive breaks may indicate weakening momentum, a change in market structure, or the beginning of a new trend.
4. Common Mistakes Beginners Make
Even experienced traders occasionally misdraw trendlines, but beginners often make the same mistakes that reduce their effectiveness. Avoid these common errors when analyzing price action:
- Forcing lines to fit the chart instead of following natural swing points.
- Ignoring wicks, which often represent important price rejections and market sentiment.
- Ignoring timeframe, as higher-timeframe trendlines generally carry more significance than lower-timeframe ones.
To improve consistency, remember that trendlines are guides, not guarantees. Also avoid:
- Constantly adjusting lines whenever new candles appear, which creates inconsistent analysis.
- Trading every touch without waiting for confirmation from price action, volume, or other technical signals before entering a position.
Automate Your Trendline Analysis with Logic Trendline for NinjaTrader (Just $10)
Drawing trendlines manually sounds simple, but in practice it can be frustrating. Should you connect the candle bodies or the wicks? Which swing highs and lows should you use? Because there are no universal rules, different traders often draw different trendlines on the same chart, leading to inconsistent analysis and unnecessary stop-outs.
That's where Logic Trendline for NinjaTrader comes in. Instead of relying on subjective judgment, the indicator automatically draws trendlines using a proprietary algorithm designed to identify high-quality trendlines that price is more likely to respect. The goal is to eliminate confusion and make trendline analysis more objective.
Compared with manual drawing, Logic Trendline saves time, improves consistency, and removes much of the guesswork. Instead of repeatedly adjusting lines, you can focus on interpreting price action and executing your trading plan with greater confidence.
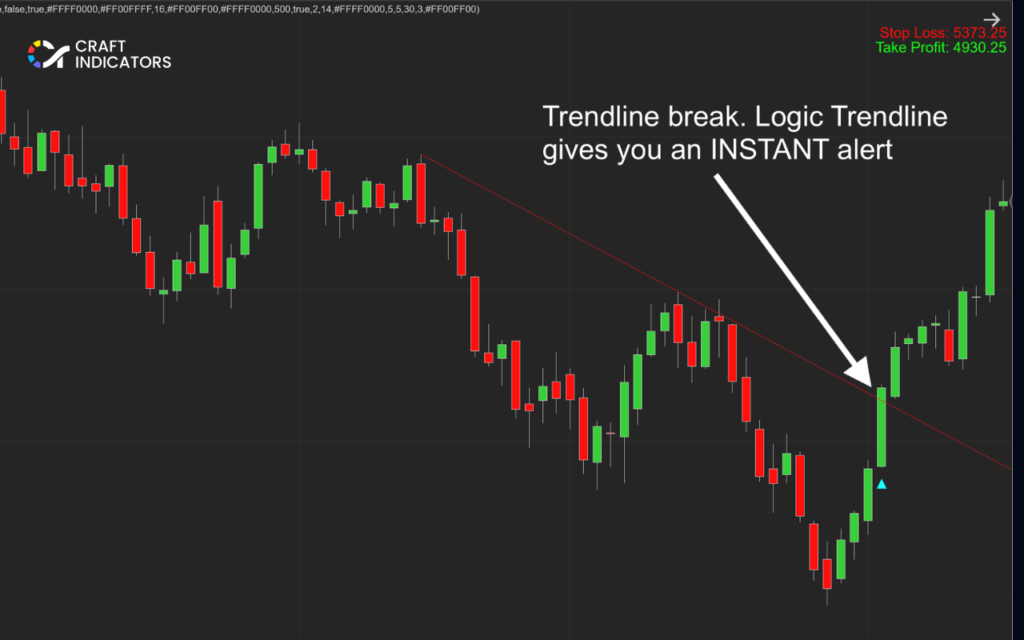
Logic Trendline is available as a one-time purchase for NinjaTrader. Once installed, simply add it to your chart, and it automatically analyzes price action and plots trendlines based on its built-in logic.
Looking for even more tools? We also offer a collection of free indicators for NinjaTrader that complement Logic Trendline and help streamline your technical analysis workflow.
Conclusion
Understanding trendlines is just the first step toward becoming a more disciplined trader. When combined with proven trading strategies and reliable technical indicators, trendline analysis can help you spot higher-quality setups and manage risk more effectively. Continue practicing, stay consistent, and build a trading approach that gives you a lasting edge in the markets.
Also, follow us for all the promotions and other useful topics:
- Facebook: www.facebook.com/craftindicators
- Instagram: www.instagram.com/craftindicators
