

A trendline may look like a simple line on a chart, but it can be one of the most powerful tools for spotting high-probability trade setups. After mastering how to use trendlines, the real challenge is knowing when to act on the signals they provide. That's exactly what this guide covers. Instead of revisiting the basics, we'll explore practical trendline trading strategy setups that traders use to identify entries and exits. Remember, no strategy is perfect, so confirming every setup and managing risk carefully are key to long-term trading success.
1. Popular Trendline Trading Strategies Every Trader Should Know
1.1 Trendline Bounce Strategy (Trading With the Trend)
The trendline bounce strategy aims to trade in the direction of the prevailing trend by entering when price respects a well-established trendline. In an uptrend, traders look to buy when price bounces from a rising trendline, which acts as dynamic support. In a downtrend, traders look to sell when price rejects a falling trendline, where the trendline acts as dynamic resistance. Instead of entering as soon as price reaches the trendline, it's important to wait for confirmation that the trend is likely to continue.
Entry Rules
To improve the probability of a successful trade:
- Wait for price to touch or approach the trendline.
- Look for confirmation before entering, such as:
- A bullish or bearish candlestick pattern
- A momentum shift in the direction of the trend
- Higher-than-average trading volume on the bounce
Stop-Loss Placement
Place your stop-loss where the trade setup is invalidated:
- Uptrend: Below the most recent swing low or slightly beneath the trendline.
- Downtrend: Above the most recent swing high or slightly above the trendline.
Profit Target
Taking profits at the previous swing high (uptrend) or swing low (downtrend).
1.2. Trendline Breakout Strategy
The trendline breakout strategy aims to capture a new price move when the market breaks through a well-established trendline. A bullish breakout occurs when price closes above a downtrend line, signaling potential buying opportunities. A bearish breakout occurs when price closes below an uptrend line, indicating potential selling pressure. Since not every breakout leads to a sustained move, traders should wait for confirmation before entering.
Entry Rules
To improve the quality of breakout trades:
- Wait for a strong candle to close beyond the trendline.
- Confirm the breakout with:
- Higher trading volume
- Momentum indicators (e.g., RSI or MACD)
- Alignment with the higher timeframe trend
Stop-Loss Placement
Protect your trade by placing the stop-loss:
- Beyond the breakout candle.
- Or beyond the broken trendline.
Common Mistakes to Avoid
Many trendline breakouts turn into false breakouts, where price quickly reverses after breaking the trendline. Entering immediately after the break without confirmation can lead to unnecessary losses. Waiting for volume confirmation, stronger momentum, or a retest of the broken trendline can help filter out fakeouts and improve the probability of success.
1.3. Break-and-Retest Strategy (Higher Probability Entry)
Many traders prefer the break-and-retest strategy because it avoids chasing a breakout. Instead of entering immediately after price breaks a trendline, traders wait for price to pull back and retest the broken trendline. If the retest holds, the trendline can act as new support or resistance, providing a higher-probability entry with lower risk.
Trendline Identification
The first step is to identify a valid trendline that the market has respected several times. In an uptrend, connect at least three higher swing lows to form a rising support line. In a downtrend, connect three or more lower swing highs to create a descending resistance line. Strong trendlines should reflect the overall market direction without cutting through multiple candle bodies. The more times price reacts to the trendline, the more meaningful a breakout becomes.
The Breakout
Rather than reacting to every move beyond the trendline, wait for a decisive breakout. Ideally, price should close beyond the line with a large candle supported by higher trading volume or stronger momentum. A convincing breakout suggests that market sentiment may be shifting and that a new price move is developing.
The Retest
After the breakout, price often retraces toward the broken trendline before continuing in the breakout direction. This pullback is known as the retest. During a bullish breakout, the former resistance should hold as new support. During a bearish breakout, previous support should become new resistance. A successful retest provides additional confirmation that the breakout is likely to continue.
The Entry
Enter the trade only after the retest is confirmed.
- Entry: Wait for a bullish or bearish confirmation candle at the retest.
- Stop-Loss: Place the stop-loss beyond the retest swing or the broken trendline.
- Take-Profit: Target the next major support or resistance level while maintaining at least a 1:2 risk-to-reward ratio.
1.4. Trendline Channel Strategy
The trendline channel strategy uses two parallel trendlines to define a market's trading range. The lower trendline acts as dynamic support, while the upper trendline serves as dynamic resistance. As long as price remains within the channel, traders can use these boundaries to identify potential entry and exit points rather than anticipating a breakout.
Bullish Channel
In an uptrend, price typically moves between the upper and lower boundaries of an ascending channel.
- Entry: Buy when price bounces from the lower trendline (support).
- Confirmation: Look for a bullish candlestick pattern, increased buying volume, or momentum turning higher.
- Take-Profit: Consider taking profits near the upper trendline (resistance).
Bearish Channel
In a downtrend, price often oscillates within a descending channel.
- Entry: Sell or short when price rejects the upper trendline (resistance).
- Confirmation: Wait for a bearish candlestick pattern or momentum confirmation before entering.
- Take-Profit: Exit the trade near the lower trendline (support).
Best Markets
The trendline channel strategy performs best in markets with sustained directional movement, including:
- Trending markets with clear higher highs and higher lows or lower highs and lower lows.
- Swing trading, where traders aim to capture repeated moves within the channel.
- Forex, stocks, and cryptocurrencies, where trending price action and well-defined channels frequently occur across multiple timeframes.
1.5. Multiple Trendline Confluence Strategy
The multiple trendline confluence strategy improves trade quality by combining a primary trendline with additional technical factors. Instead of relying on a single line, traders wait for several support or resistance signals to align at the same price area. This creates a stronger confluence zone where buyers or sellers are more likely to enter the market.
Step 1: Identify the Primary Trend
Begin on the 1-hour or 4-hour chart to determine the dominant trend.
- Draw an ascending trendline by connecting at least two higher swing lows in an uptrend.
- Draw a descending trendline by connecting at least two lower swing highs in a downtrend.
- A third touch of the trendline often provides the strongest trading opportunity.
- If possible, create a parallel trendline to form a trend channel and estimate future price targets.
Step 2: Build the Confluence Zone
A single trendline can easily break. To validate your trade, look for at least one or two of these overlapping factors to intersect your main trendline:
Horizontal Support and Resistance
- Mark previous swing highs and swing lows where price has repeatedly reversed.
- Give extra attention when these levels intersect the trendline.
- The overlap creates a stronger support or resistance zone than either indicator alone.
Moving Averages
- Apply the 50 EMA to identify short- to medium-term dynamic support and resistance.
- Use the 200 EMA to confirm the longer-term trend.
- When price pulls back to a trendline that also aligns with one of these moving averages, the setup carries greater weight.
Counter-Trendline
- During a pullback, draw a smaller trendline against the main trend.
- Wait for price to break this short-term trendline while still holding the primary trendline.
- This often signals that the pullback has ended and the primary trend is resuming.
2. Risk Management Tips for Trendline Trading
Even the best trendline trading strategy can produce losing trades, making risk management just as important as finding the right setup. Following a few simple rules can help protect your capital and improve long-term consistency.
Never Trade Every Touch
Not every trendline touch leads to a profitable trade. Wait for confirmation, such as a bullish or bearish candlestick pattern, increased volume, or momentum confirmation before entering. Being patient helps filter out low-quality setups.
Use Proper Position Sizing
Risk only a small percentage of your trading capital on each trade, typically 1% to 2%. Consistent position sizing limits the impact of losing trades and helps preserve your account during periods of market volatility.
Expect False Breakouts
False breakouts are common in all financial markets. Instead of entering as soon as price breaks a trendline, wait for additional confirmation, such as a strong candle close, higher volume, or a successful retest of the broken trendline. This can significantly reduce the likelihood of getting caught in fake moves.
Avoid Overdrawing Trendlines
Drawing too many trendlines can clutter your chart and create conflicting signals. Focus only on well-established trendlines that connect significant swing highs or lows and have been respected by price multiple times. A clean chart makes it easier to identify high-quality trading opportunities.
3. Logic Trendline for NinjaTrader Indicator
Throughout this guide, you've learned how to trade trendline bounces, breakouts, retests, channels, and confluence setups. However, one challenge remains: drawing consistent trendlines. Because trendlines are subjective, two traders can analyze the same chart and identify completely different setups, leading to inconsistent trading decisions.
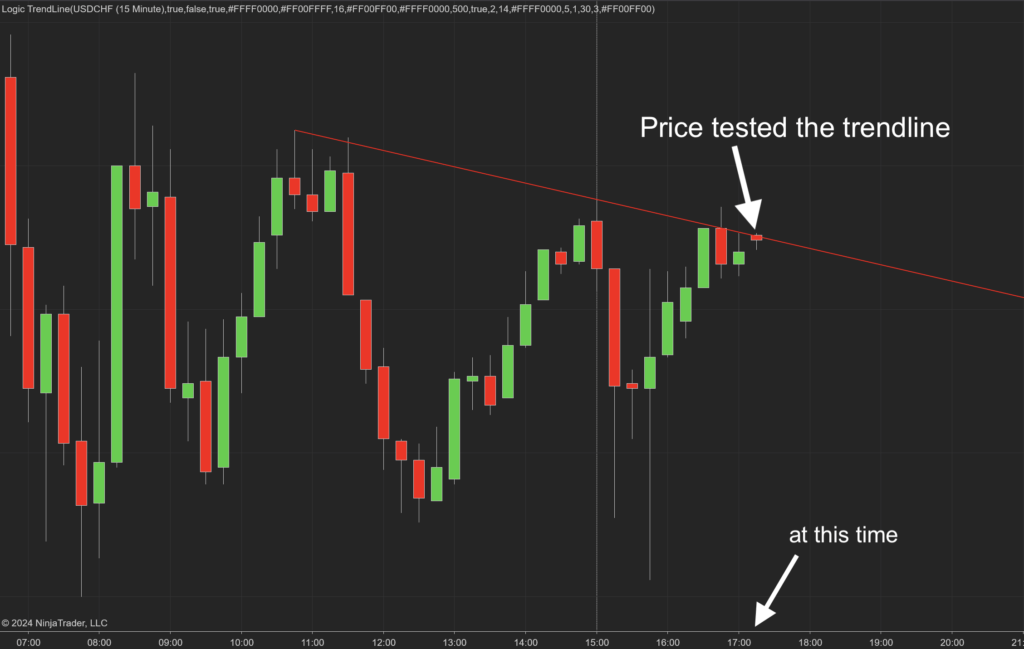
The Logic Trendline for NinjaTrader Indicator helps solve this problem by automatically identifying and plotting trendlines based on predefined logic instead of manual interpretation. This allows you to spend less time drawing lines and more time evaluating high-quality trading opportunities. Whether you're looking for bounce trades, breakout entries, or trendline confluence, the indicator can help streamline your chart analysis and improve consistency.
Why Traders Use the Logic Trendline Indicator
The indicator is designed to support many of the strategies covered in this guide by helping you:
- Automatically identify potential support and resistance trendlines.
- Spot breakout and break-and-retest opportunities more efficiently.
- Build stronger confluence setups with moving averages and horizontal support/resistance.
- Reduce the subjectivity of manually drawing trendlines.
- Save time when analyzing multiple charts and timeframes.
Limited-Time Special Offer
If you'd like to automate your trendline analysis, now is a great time to try the Logic Trendline for NinjaTrader Indicator. For a limited time, it's available for just $10, making it an affordable way to incorporate automated trendline detection into your trading workflow.
Whether you're a new trader learning trendline strategies or an experienced trader looking to improve efficiency, this limited-time offer provides an easy way to put the concepts from this guide into practice.
Final Thoughts
A well-defined trendline trading strategy can help you identify high-probability trading opportunities, but no strategy is foolproof. Trendlines work best when combined with market structure, support and resistance, volume, and candlestick confirmation rather than being used as standalone trading signals. By practicing proper trendline analysis and applying sound risk management, you can improve your ability to identify trend continuations, breakouts, and potential reversals. Remember, consistency in your analysis is just as important as consistency in your trading decisions.
Also, follow us for all the promotions and other useful topics:
- Facebook: www.facebook.com/craftindicators
- Instagram: www.instagram.com/craftindicators
