

Markets can look chaotic at first glance, but trendlines help bring structure to seemingly random price movements. If you've been wondering what a trendline is, it's a simple concept: connect important swing highs or lows with straight lines to reveal the market's underlying direction.
Despite their simplicity, trendlines are among the most versatile tools in technical analysis. They help traders understand trends, identify key price levels, and evaluate whether market momentum is strengthening or weakening.
This guide explains how to use trendlines effectively. You'll learn when trendlines provide meaningful insights and how to incorporate them into your market analysis with greater confidence.
1. Before Using Trendlines: Draw Them Correctly
Before applying trendlines in your trading analysis, you need to know how to draw trendlines correctly. Using a consistent method ensures your trendlines represent meaningful price structure and provide more dependable market insights.
Step 1: Start with a Clear Trend
Identify whether the market is in an uptrend or downtrend before drawing a trendline. Focus on the overall price direction rather than short-term fluctuations.
Step 2: Locate Major Swing Highs or Lows
Find at least two significant price pivots. In an uptrend, connect swing lows; in a downtrend, connect swing highs.
Step 3: Draw the Trendline
Connect the most important price pivots with a single, clean line. Avoid forcing the trendline to fit every price movement or minor wick.
Step 4: Wait for Additional Confirmation
A third or subsequent touch increases the trendline's reliability and shows that the market continues to respect it.
2. How Traders Use Trendlines
2.1. Identify the Direction of the Trend
One of the greatest strengths of trendlines is their ability to define market structure. By connecting significant swing highs or lows, traders can quickly determine whether price is making higher highs and higher lows, or lower highs and lower lows. This provides an objective view of the current trend.
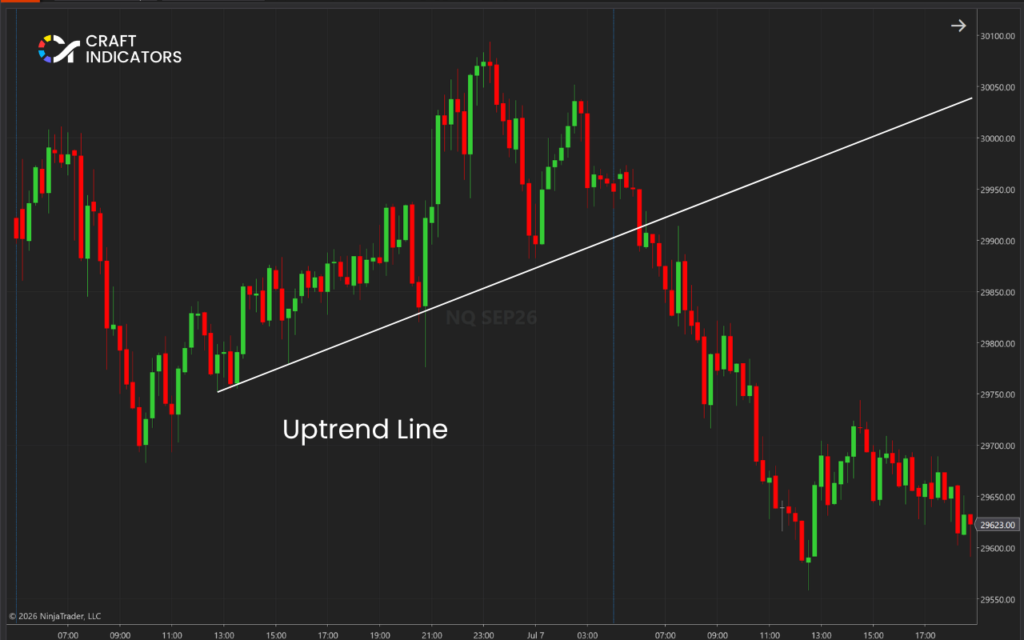
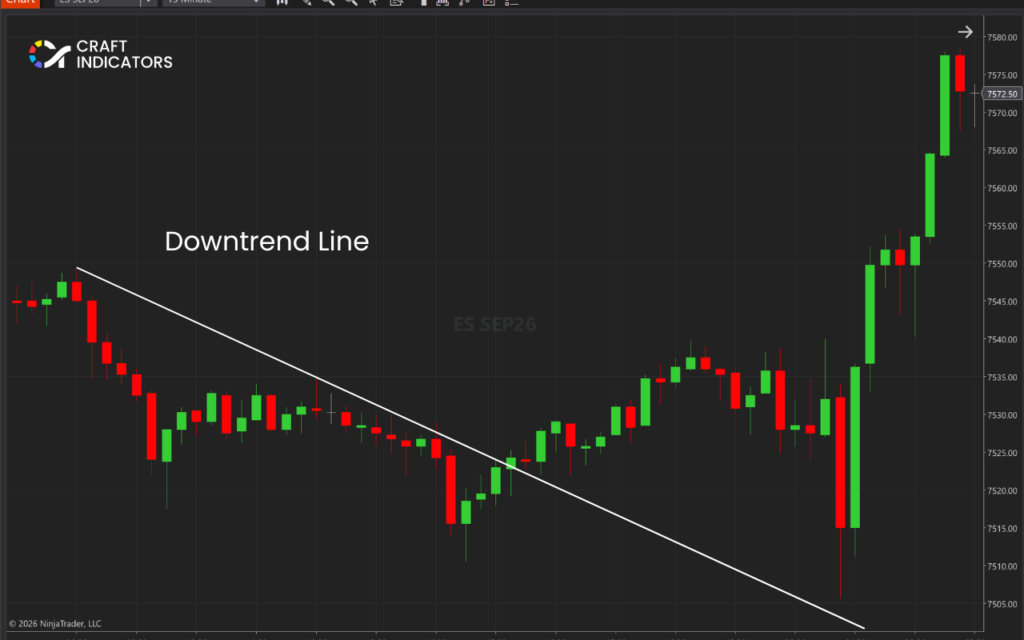
Identifying the trend helps traders eliminate trades that conflict with the broader market direction. Trading in the direction of the prevailing trend often offers better probability because it aligns with the dominant buying or selling pressure.
As trends evolve, their structure can begin to weaken. Smaller trendline reactions, weaker pullbacks, or a clear break below or above the trendline may indicate that buyers or sellers are losing control. Recognizing these changes early allows traders to adapt before market conditions change completely.
2.2. Find Dynamic Support and Resistance
Trendlines act as dynamic support and resistance, adapting as the market moves. In an uptrend, an ascending trendline often serves as dynamic support, where price may pause or bounce before continuing higher. In a downtrend, a descending trendline functions as dynamic resistance, limiting upward price movements.
Unlike horizontal support and resistance, which remain fixed at specific price levels, trendlines are diagonal and adjust with the market's direction. This makes them particularly useful in trending markets, where support and resistance levels evolve alongside changing price action.
It's important to remember that trendlines represent zones, not exact prices. A valid trendline doesn't require price to touch the line perfectly. Small overshoots or undershoots are normal because of market volatility. Instead of focusing on precise contact, traders should look for consistent price reactions around the trendline to confirm its significance.
2.3. Spot Potential Trend Reversals
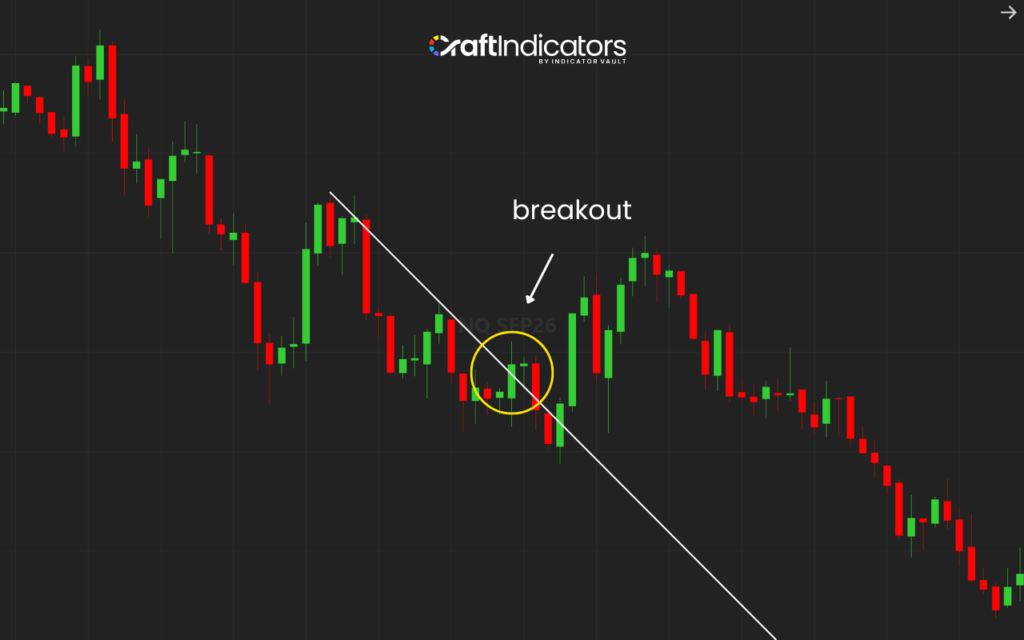
Another valuable use of trendlines is spotting when a trend may be coming to an end. If price no longer respects the trendline and breaks through it, the market could be entering a period of weakening momentum or preparing for a new direction.
Still, it's important not to assume that every trendline break signals a reversal. Financial markets often experience temporary breaks that quickly reverse, trapping traders who react too early.
Instead, pay attention to how price behaves after the break. A developing sequence of higher highs and higher lows or lower highs and lower lows provides stronger evidence that the market structure has actually changed.
Before reaching a conclusion, look for supporting signals such as rising trading volume and reversal candlestick patterns. Combining multiple forms of confirmation helps distinguish genuine trend reversals from ordinary market noise.
2.4. Confirm Breakouts of Chart Patterns
Trendlines are more than standalone analysis tools. They form the foundation of many chart patterns. By defining pattern boundaries, they help traders recognize when a breakout is more likely to signal a continuation or reversal of the prevailing trend.
- Triangles: Trendlines connect converging highs and lows, helping confirm a breakout when price closes outside the pattern.
- Wedges: Rising and falling wedge trendlines highlight weakening momentum and potential breakout points.
- Channels: Parallel trendlines define dynamic support and resistance, making breakouts beyond the channel easier to identify.
- Flags: Trendlines outline the consolidation phase, helping validate continuation breakouts after a strong price move.
2.5. Measure Trend Strength
Last but not least, trendlines are useful for evaluating how strong a trend really is. By looking at the slope of the line, traders can quickly judge whether price is moving steadily, accelerating, or beginning to slow down.
A smooth and consistent slope generally points to a healthy trend. When the trendline becomes very steep, momentum is usually strong, but these fast moves often struggle to continue for long periods.
A flattening trendline is often an early sign that momentum is fading. Buyers or sellers may still be in control, but their influence is becoming weaker.
Another important clue is how often the trendline must be adjusted. Multiple redraws can suggest that momentum is changing and that the market is transitioning into a different phase.
Read More: Master the Trendline Trading Strategy for Better Entries
3. Logic Trendline for NinjaTrader Indicator
Now that you know how traders use trendlines in trading, why not put those concepts into practice? If you're a NinjaTrader 8 user, Logic Trendline helps automate trendline analysis, so you can spend less time drawing lines and more time evaluating trading opportunities. For a limited time, it's available for just $10.
Why choose Logic Trendline over manual trendlines?
- Objective analysis: Draws trendlines using predefined rules instead of personal judgment.
- Consistent results: Eliminates differences caused by manually selecting swing highs and lows.
- Automatic updates: Redraws trendlines as market structure changes, saving time.
- Faster analysis: Instantly identifies valid trendlines across multiple markets and timeframes.
Ready to trade with greater consistency? Get the Logic Trendline for NinjaTrader Indicator today and claim the limited-time $10 special offer.
Also, follow us for all the promotions and other useful topics:
- Facebook: www.facebook.com/craftindicators
- Instagram: www.instagram.com/craftindicators
