

Market prices contain both useful information and unpredictable short-term variation. For traders, the challenge is distinguishing the underlying price structure from fluctuations that can produce false signals. A technical noise filter can help by smoothing high-frequency movements while retaining information about broader trends. However, filtering is a trade-off: excessive smoothing may remove useful signals or introduce additional lag. Understanding how to filter out market noise therefore requires more than choosing the smoothest indicator.
In this guide, we’ll compare conventional trading tools with advanced statistical methods, including Kernel Smoothing, and examine how each approach can improve signal interpretation without claiming to eliminate market uncertainty.
1. What Is Market Noise?
Market noise refers to short-term price movements that do not necessarily reflect a meaningful change in market direction. It can appear as random fluctuations, temporary volatility, sudden spikes, or brief reversals within a broader trend.
The challenge is distinguishing these movements from genuine trend changes or structural market shifts caused by factors such as news, economic data, or changing market conditions. Temporary volatility may quickly disappear, while a genuine trend can persist and develop into a larger move.
However, this distinction is difficult in real time because traders cannot know immediately whether a price movement is random noise or the beginning of something more significant.
Common Examples of Market Noise
Market noise can take several forms on a trading chart. Recognizing these patterns can help traders avoid reacting to every short-term movement.
Random Candles
- Isolated price spikes or drops that have little connection to the broader trend.
- Candles that quickly reverse and leave little evidence of sustained momentum.
- Short-lived movements with limited follow-through can create misleading signals.
Whipsaws
- Price repeatedly crosses a trend indicator, creating frequent buy and sell signals.
- Traders may enter and exit multiple times as direction appears to change.
- Whipsaws are particularly common when markets move sideways without a clear trend.
False Breakouts
- Price moves beyond established support or resistance.
- The breakout quickly fails and returns to the previous trading range.
- Traders may enter just before the reversal, turning an apparent opportunity into a losing trade.
Short-Term Price Spikes
- Sudden moves can result from volatility, news, or temporary order imbalances.
- These spikes can distort trend-following indicators and make short-term momentum appear stronger than it actually is.
Why Market Noise Varies by Market and Timeframe
Market noise does not look the same across every financial market. Stocks may experience sudden movements around earnings or economic news, while forex often responds to currency flows and macroeconomic releases. Crypto can show sharp, unpredictable price swings because of its continuous trading and changing liquidity. Futures may also experience rapid movements around scheduled economic events or periods of high market activity.
Noise also changes with the trading timeframe. Intraday trading exposes traders to frequent small fluctuations, while swing trading focuses on movements that develop over several days. On higher timeframes, many short-term fluctuations become less significant, allowing broader trends and structural changes to stand out more clearly.
Volatility matters too. High-volatility environments can produce larger price swings and more apparent noise, while low-volatility markets may generate smaller but frequent movements.
For this reason, a filter suitable for a 5-minute chart may be too slow or too aggressive on a daily chart. Effective filtering should match the market, timeframe, and trading approach.
2. Why Market Noise Causes Losing Trades
2.1. Late or Premature Entries
Market noise can make a trading opportunity appear before a genuine trend has formed. Short-term price fluctuations may push the market above resistance, below support, or across a technical indicator, tempting traders to enter before there is enough confirmation. If the movement quickly fades, the trade may reverse shortly after entry.
Noise can also create late entries. Traders may wait for several conflicting signals to disappear, only to enter after much of the meaningful price movement has already occurred. This creates a difficult balance: reacting too quickly can lead to false entries, while waiting too long can mean missing the strongest part of a move.
2.2. False Reversals
Sometimes a trend looks finished when it really isn't. Price can suddenly move against the prevailing direction, break a minor level, and trigger several bearish or bullish signals. To a trader watching the chart in real time, this can look like the start of a major reversal. But after a few candles, price may turn around and continue following the original trend.
This is where market noise becomes particularly misleading. A temporary pullback can be mistaken for a structural change, causing traders to exit too early or take a position in the wrong direction. Filtering short-term fluctuations can make these false reversals easier to recognize.
2.3. Repeated Whipsaw Losses
Whipsaw conditions can turn a series of seemingly reasonable trades into repeated small losses. A trader may enter when price appears to break in one direction, only to be stopped out when the movement quickly reverses. If price then moves back and triggers another signal, the trader may re-enter, repeating the same cycle.
This pattern is especially common in choppy markets where there is no clear trend. While each individual loss may seem manageable, repeated entries, stop-outs, and re-entries can gradually erode trading capital. Filtering market noise can help traders avoid reacting to every short-term movement and reduce unnecessary trades.
2.4. Emotional Trading
Frequent false signals can affect more than a trader’s entries, they can also influence decision-making. When market noise repeatedly triggers losing trades, traders may begin overtrading in an attempt to recover losses or engage in revenge trading after a frustrating exit. Others may become hesitant, missing valid opportunities because they no longer trust their signals. Premature exits can also occur when normal price fluctuations are mistaken for signs of danger.
Filtering market noise cannot remove emotions from trading, but it can help reduce unnecessary reactions to insignificant price movements. By focusing on clearer signals, traders can build a more consistent decision-making process and follow their trading plan with greater discipline.
3. Traditional Market Noise Filters
3.1. Simple Moving Average (SMA)
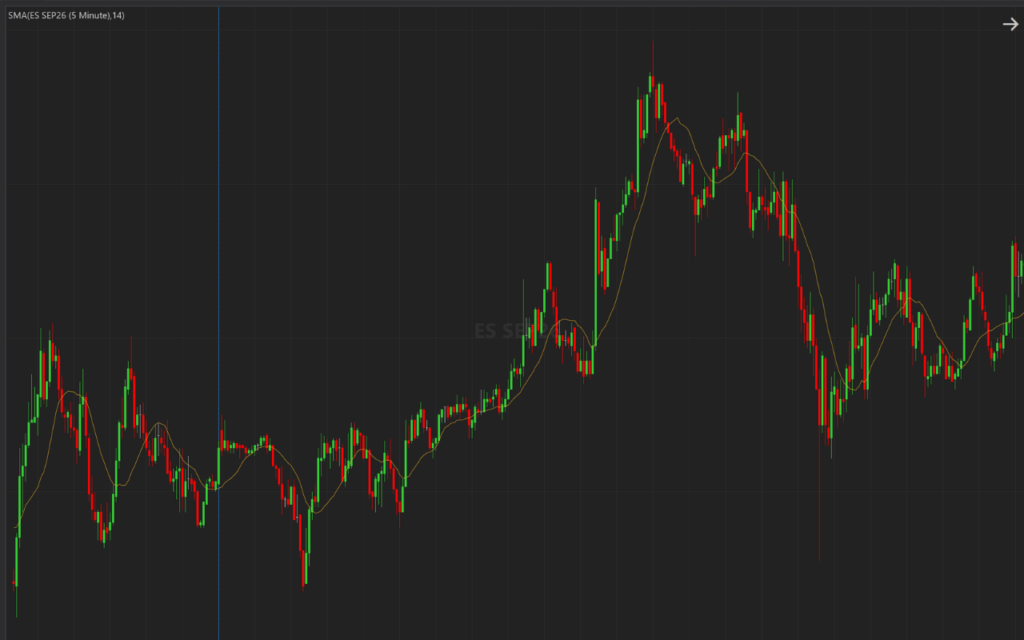
A Simple Moving Average (SMA) smooths price data by calculating the average closing price over a selected number of periods. By combining multiple prices into one value, an SMA reduces the impact of short-term fluctuations and makes the broader direction of the market easier to see.
Strengths:
- Simple to calculate and understand.
- Easy to interpret on a trading chart.
- Useful for identifying broad market trends.
However, an SMA has some limitations. It gives every price in the selected period equal weight, which can make it slow to respond to recent changes.
Limitations:
- Uses fixed weighting for all prices.
- Can react slowly to sudden price changes.
- Results are sensitive to the selected period.
3.2. Exponential Moving Average (EMA)
An Exponential Moving Average (EMA) is a popular technical tool for smoothing price data. Unlike an SMA, it gives more weight to recent prices, allowing the average to respond more quickly to new market movements.
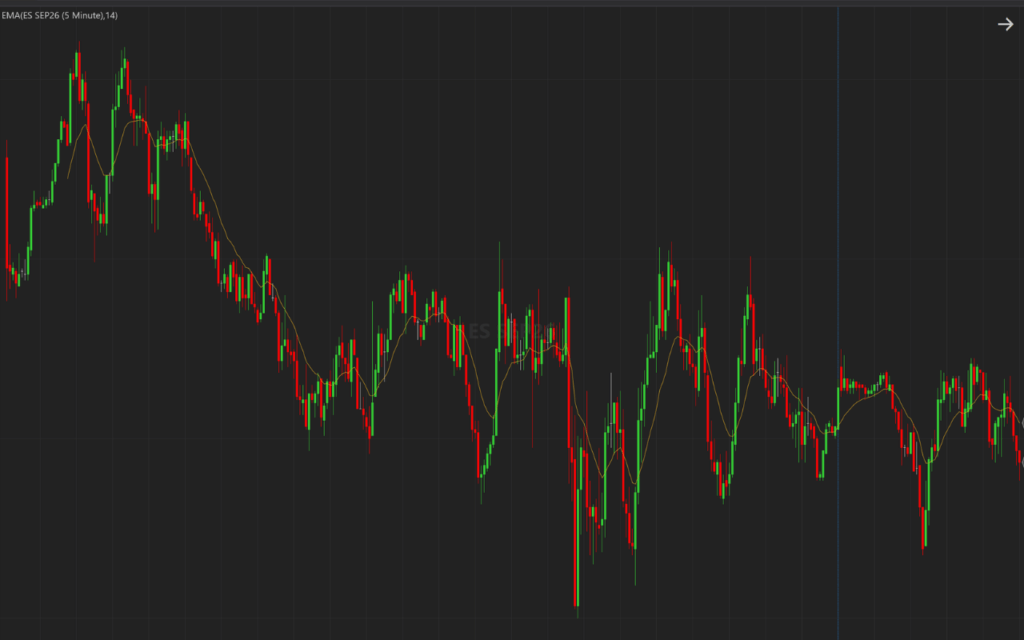
This added responsiveness can help traders spot potential trend changes earlier. However, it also creates a trade-off between reducing noise and minimizing lag. A faster EMA may react quickly, but it can also respond to insignificant price fluctuations.
In choppy markets, even a short EMA can generate repeated crossovers as price moves back and forth.
This may result in:
- False trend signals.
- Frequent entries and exits.
- Whipsaw losses.
3.3. Average True Range (ATR)
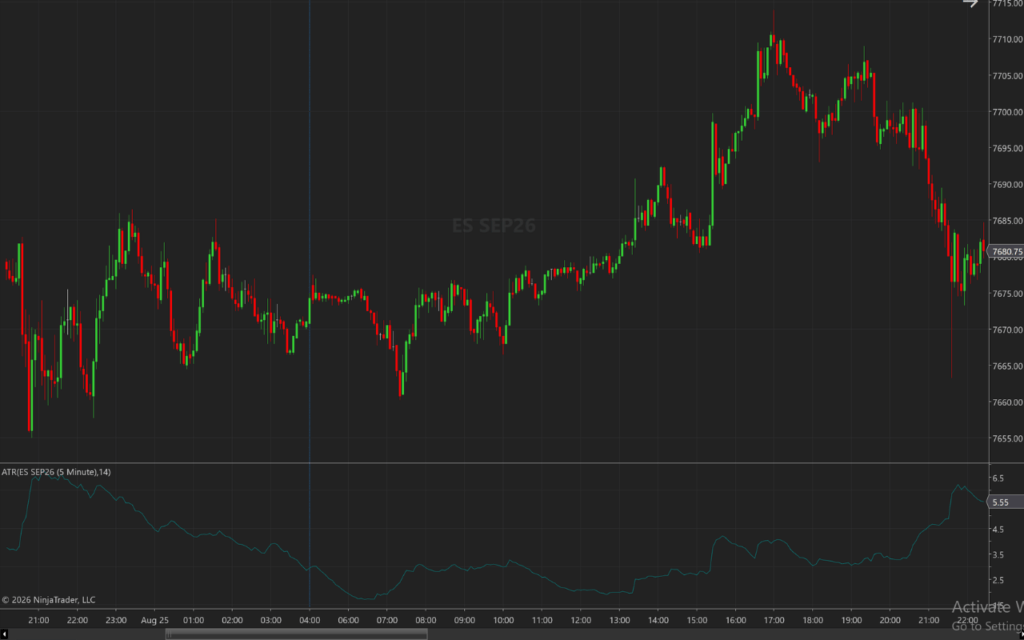
The Average True Range (ATR) is primarily a volatility indicator, not a trend-smoothing tool. It measures the typical range of price movement over a selected period, helping traders understand how much an asset is moving rather than which direction it is trending.
A higher ATR can indicate unusually large price movements, while a lower ATR may suggest calmer market conditions. Traders can use this information to distinguish normal fluctuations from periods of elevated volatility that may create misleading signals or wider price swings.
ATR can also complement a smoothing filter. While the filter reduces short-term noise, ATR provides volatility context, helping traders interpret whether a movement is relatively normal or unusually large.
3.4 Bollinger Bands
Bollinger Bands combine a moving average with standard deviation to create dynamic upper and lower bands around price. Because the bands adjust to recent price variability, they can help traders see when prices are moving within relatively calm or volatile conditions.
When the bands expand, it generally indicates increasing volatility and larger price movements. When they contract, volatility is typically decreasing, and the market may be entering a quieter period. This can provide useful context when evaluating potential trading signals.
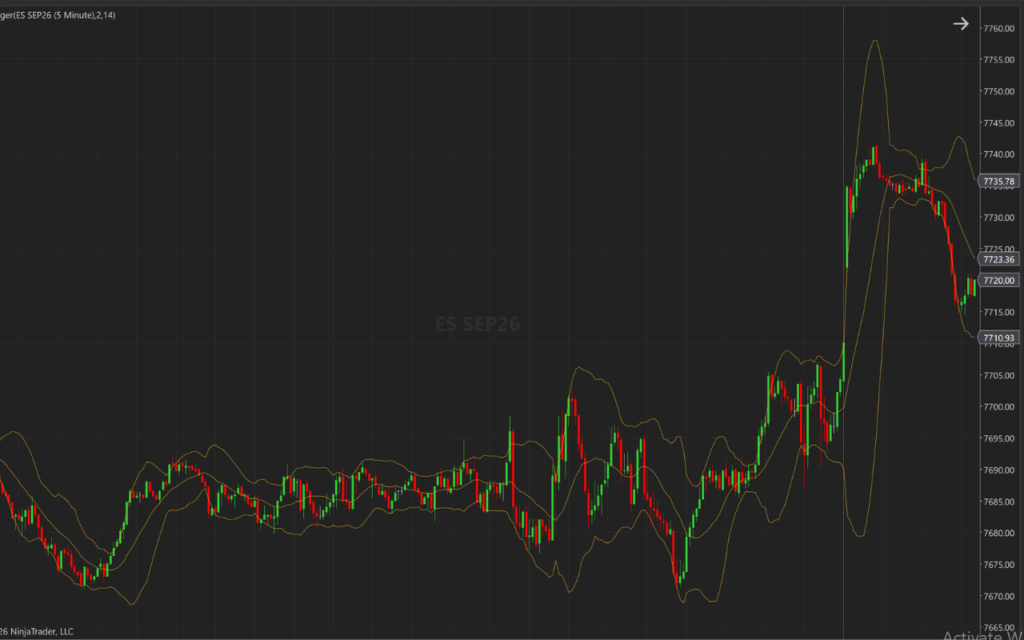
However, touching or moving beyond an upper or lower band does not automatically mean price will reverse. Strong trends can remain near a band for extended periods, so traders should consider broader market context before treating a band touch as a reversal signal.
4. Advanced Market Noise Filtering Methods
4.1. Kalman Filter
The Kalman Filter is a mathematical method designed to estimate an underlying signal from observations that contain noise. Instead of treating every price movement as meaningful, it continuously combines new observations with its previous estimate to produce a cleaner representation of the underlying market state.
This makes the Kalman Filter useful for financial time-series filtering, where prices can change rapidly and contain significant short-term fluctuations. It can help traders identify broader price movement while reducing the influence of temporary noise.
Strengths:
- Adaptive estimation that updates as new data becomes available.
- Useful in dynamic market environments where conditions can change quickly.
- Can provide a smoother estimate without relying solely on a fixed moving average.
Limitations:
- More complex than traditional indicators such as SMA or EMA.
- Results depend on underlying model assumptions and parameter choices.
- Its mathematical output can be harder for ordinary traders to interpret and apply consistently.
4.2. Wavelet Filtering
Wavelet Filtering takes a different approach to reducing market noise by breaking price data into components based on frequency. Instead of smoothing the entire price series uniformly, it separates short-term and longer-term movements so each can be analyzed independently.
In this framework, high-frequency components often represent rapid price changes, isolated spikes, or other short-lived fluctuations that may be treated as noise. Lower-frequency components generally capture broader movements that develop over longer periods, making them useful for examining underlying trends and market structure.
Strengths:
- Multi-scale analysis: Examines price behavior across multiple time horizons.
- Flexible noise reduction: Allows specific frequency components to be reduced or removed.
- Can preserve broader price movements while reducing short-term fluctuations.
Limitations:
- Technically complex: Requires more mathematical knowledge than conventional indicators.
- Parameter selection can be difficult: Different wavelet types and filtering thresholds can produce different results.
- The output may be less intuitive for traders unfamiliar with frequency-based analysis.
4.3. Gaussian Filtering
Gaussian Filtering smooths price data by assigning different weights to observations based on their distance from the point being estimated. The weighting follows a Gaussian-shaped distribution, giving nearby observations greater influence while gradually reducing the effect of more distant data points.
This approach can reduce abrupt price changes and produce a smoother curve than raw market data. By softening sudden spikes and short-term fluctuations, Gaussian filtering can make broader price movement easier to observe without treating every candle as a meaningful signal.
However, stronger smoothing comes with trade-offs. A wider filter can introduce lag, causing the smoothed line to react more slowly to new price movements. Gaussian filters can also experience edge effects, where estimates near the beginning or end of a data series may behave differently because fewer neighboring observations are available.
4.4. Kernel Smoothing
Kernel Smoothing is a statistical technique that estimates an underlying price trend by applying weighted averaging to market data. Instead of giving every observation the same influence, it uses a mathematical function called a kernel to determine how much weight each price should receive when estimating the value at a particular point.
The key idea is that observations closer to the point being estimated generally receive greater weight, while observations farther away have less influence. This creates a flexible way to combine nearby price information without treating every data point equally. The shape and width of the kernel determine how quickly the influence decreases with distance.
By weighting observations in this way, Kernel Smoothing can reduce the impact of isolated spikes, sudden fluctuations, and other short-term noise. The resulting curve provides a smoother estimate of the underlying price trend, making broader market direction easier to interpret without simply averaging all observations equally.
Read More: Kernel Density Estimation – How KDE Works and How It Differs From Kernel Smoothing
5. Why Kernel Smoothing Is Effective for Market Noise Filtering
When charts contain frequent spikes and reversals, traders need a way to reduce distractions without losing important market movement. Kernel Smoothing addresses this challenge through:
- Adaptive Weighting: Instead of treating every observation equally, it assigns different weights according to distance, allowing nearby prices to have more influence.
- A Better Smoothness, Responsiveness Trade-Off: The smoothing level can be adjusted to remove unwanted fluctuations while maintaining a reasonable response to meaningful price changes.
- Smoother Trend Identification: A cleaner price curve can make underlying trends easier to distinguish from temporary market noise.
However, Kernel Smoothing is a filter, not a prediction engine. It reduces short-term price noise and clarifies existing trends, but it cannot predict future movements, eliminate uncertainty, or guarantee profitable trading decisions.
6. Common Market Noise Filtering Mistakes
Filtering noise sounds simple: remove the distracting price movements and focus on the trend. In practice, it is easier said than done. Too much filtering can hide useful information, while too little may leave traders reacting to every market fluctuation. Several mistakes are especially common:
- Over-Filtering the Price: Smoothing the chart too heavily can make genuine movements difficult to see.
- Ignoring Volatility: A filter that works in a quiet market may respond differently when price swings become larger.
- Using the Wrong Timeframe: Filtering should fit the timeframe rather than relying on one setting everywhere.
- Treating Every Price Movement as Noise: Some sudden moves are meaningful and should remain visible.
- Optimizing Parameters Too Much: Over-tuning can make historical results look better without improving real-world performance.
- Using a Filter Without Risk Management: Filtering improves signal clarity, but it cannot prevent losses or replace disciplined risk management.
7. How Top Bottom Finder Indicator Filters Market Noise
As discussed above, filtering market noise is not about removing every price fluctuation. The goal is to reduce insignificant movements while keeping the broader market structure visible. This principle is also central to how the Top Bottom Finder Indicator for NinjaTrader 8 processes price data.
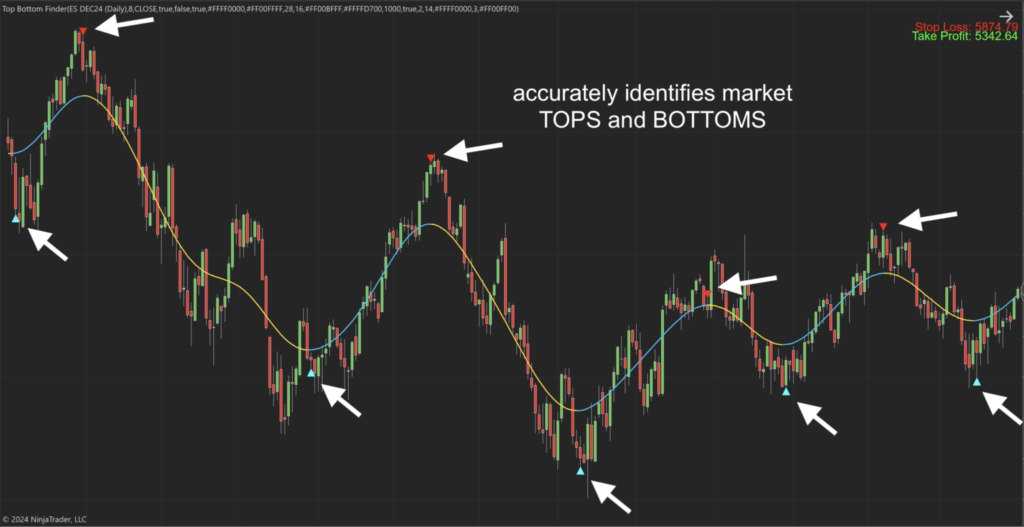
It uses Kernel Smoothing to give greater weight to relevant nearby observations, helping reduce the effect of abrupt short-term movements. This creates a smoother representation of the market that can make potential turning points easier to evaluate. Instead of allowing every spike or pullback to influence the overall picture, the indicator helps bring the underlying price movement into clearer focus.
Conclusion
Market noise is an unavoidable part of trading, but it does not have to dominate your analysis. From moving averages and volatility tools to advanced methods such as Kernel Smoothing, filtering can help reveal more meaningful price movement. The key is finding the right balance between smoothness and responsiveness while maintaining realistic expectations and disciplined risk management.
Also, follow us for all the promotions and other useful topics:
- Facebook: www.facebook.com/craftindicators
- Instagram: www.instagram.com/craftindicators
