
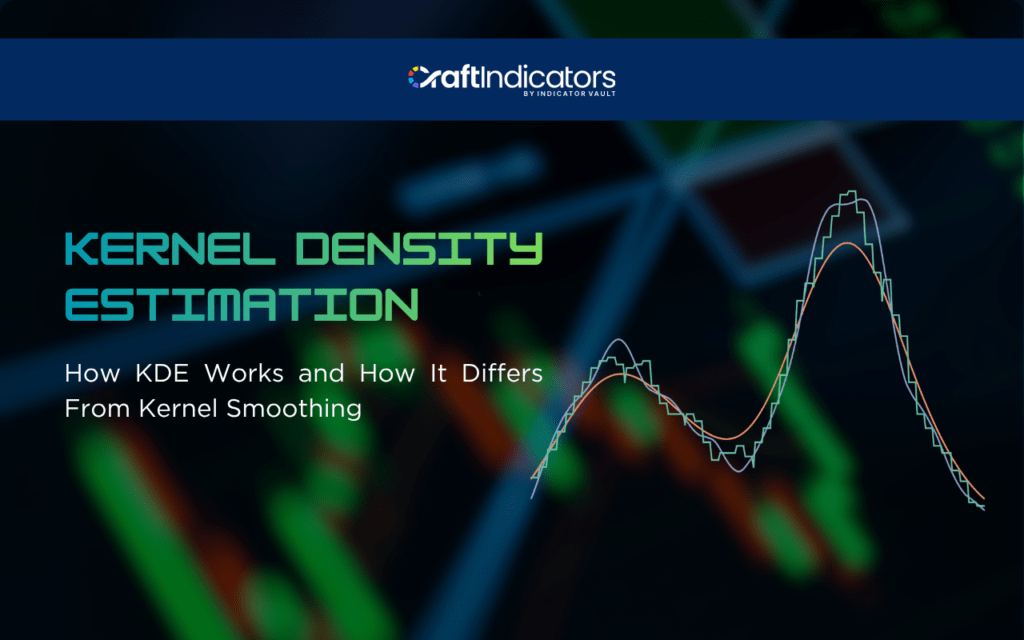
Financial markets are full of noise. Prices fluctuate, returns vary, and market conditions can change quickly, making it challenging to understand where data is concentrated or which observations are unusual. This is where Kernel Density Estimation (KDE) can help. KDE is a non-parametric statistical technique that estimates the probability distribution of financial data, giving traders another way to analyze market behavior.
However, KDE is often confused with kernel smoothing because both rely on kernels and bandwidth to create smoother estimates. While they are closely related, they serve different purposes. Understanding this distinction can help traders use KDE more effectively and recognize where it fits into a broader trading toolkit.
1. What Is Kernel Density Estimation (KDE)?
Kernel Density Estimation (KDE) is a non-parametric statistical method used to estimate the probability distribution of a dataset. Unlike methods that assume data follows a specific distribution, such as a normal distribution, KDE uses the observations themselves to construct a smooth density curve. In trading, this means KDE can help estimate how variables such as returns, prices, or volatility are distributed.
The term “density” refers to how concentrated observations are within a particular range of values. A high-density area contains many observations, while a low-density area contains relatively few. For example, if most historical daily returns fall between -1% and 1%, KDE would produce a higher density around that range, making it easier to see where market outcomes tend to cluster.
Rather than simply plotting every individual observation, KDE creates a smooth representation of where observations are concentrated. It does this by placing a small curve, or “kernel,” around each data point and combining those curves. The resulting density estimate reveals features such as common value ranges, multiple clusters, and areas where observations are relatively uncommon.
KDE in Simple Terms
In simple terms, think of KDE as turning a collection of scattered observations into a smooth map of where the data tends to gather. For traders, this can provide a clearer view of the distribution of historical returns or other market variables without forcing the data into a predefined statistical model.
KDE vs. a Histogram
KDE is similar to a histogram, but there is an important difference. A histogram divides observations into fixed bins, while KDE produces a continuous curve. This makes KDE less dependent on arbitrary bin boundaries and can provide a smoother, more intuitive view of the underlying distribution.
2. How Does Kernel Density Estimation Work?
Kernel Density Estimation (KDE) works by taking historical observations and transforming them into a smooth estimate of their probability distribution. In trading, the data used for KDE can include different market variables, such as:
- Daily returns
- Price changes
- Volatility
- Trading volume
- Indicator values
Step 1: Collect historical data. The first step is to select the market variable you want to analyze and gather enough historical observations. For example, a trader could use several years of daily returns to estimate how frequently different return levels have occurred.
Step 2: Apply a kernel to each observation. KDE places a small probability “bump” around every data point. The Gaussian kernel is one of the most commonly used options and produces a smooth, bell-shaped bump. The choice of kernel determines the shape of these individual bumps, while the bandwidth controls how wide they are.
Step 3: Combine the kernels. KDE adds all the individual kernels together to create one continuous density curve. Where many observations overlap, the curve forms peaks. Where observations are less concentrated, it creates valleys.
Step 4: Interpret the density. Traders can use the resulting curve to examine common return ranges, unusual observations, multiple market regimes, distribution asymmetry, and fat tails. KDE therefore provides a visual way to understand how market data has behaved historically.
3. The Role of Bandwidth in KDE
Bandwidth is one of the most important parameters in Kernel Density Estimation because it controls how much each observation is smoothed. In simple terms, bandwidth determines the width of the “bump” placed around each data point. Changing it can significantly alter the shape of the final density curve, which means traders need to choose it carefully when analyzing market data.
Small Bandwidth
A small bandwidth produces a more detailed density estimate. The curve can contain more peaks and valleys, allowing it to capture subtle patterns in the data. However, this detail can come at a cost. When bandwidth is too small, KDE may become overly sensitive to random fluctuations and market noise, making the distribution appear more complex than it really is.
Large Bandwidth
A large bandwidth creates a smoother distribution with fewer peaks and valleys. This can make broader patterns easier to identify, but excessive smoothing may hide meaningful features in the data. For example, distinct clusters of returns could merge into a single broad peak.
Why Bandwidth Matters in Trading
The appropriate bandwidth can depend on several factors:
- Market noise: Noisy data may require greater smoothing.
- Sample size: Larger datasets can support more detailed estimates.
- Timeframe: Intraday and daily data may have different distributions.
- Market regimes: Volatility and behavior can change over time.
For this reason, bandwidth should be treated as an important modeling decision rather than a fixed setting.
4. Kernel Smoothing vs. Kernel Density Estimation
4.1. What Is Kernel Smoothing?
Kernel smoothing is a statistical technique used to estimate a smooth underlying relationship or signal from noisy observations. Rather than treating every fluctuation as meaningful, it assigns greater weight to observations that are closer together, producing a smoother representation of the data.
In trading, kernel smoothing can be applied to price and other time-series data to reduce short-term market noise and make broader trends easier to identify. This can help traders focus on the underlying direction of a market rather than reacting to every small price movement.
4.2. The Key Differences Between Kernel Smoothing and Kernel Density Estimation
| Feature | Kernel Smoothing | Kernel Density Estimation (KDE) |
| Primary purpose | Smooth noisy data to reveal an underlying signal or relationship | Estimate the probability density of a dataset |
| Typical trading use | Smoothing price or time-series data to identify trends | Analyzing the distribution of returns, volatility, prices, or other variables |
| Role of the kernel | Determines how nearby observations are weighted when smoothing | Creates a density “bump” around each observation |
| Role of bandwidth | Controls the degree of smoothing | Controls how smooth or detailed the estimated distribution is |
| What peaks represent | Potential underlying trends or changes in the signal | Areas where observations are more densely concentrated |
| Example in trading | Smoothing price data to filter short-term noise | Estimating where historical daily returns tend to cluster |
4.3. Why They Are Related
Kernel smoothing and Kernel Density Estimation (KDE) are closely related because they are built around the same fundamental idea: using a kernel function to give different weights to observations based on their distance. Observations that are closer to the point being estimated generally receive greater weight, while more distant observations have less influence.
Both techniques also rely heavily on bandwidth, which controls how broadly observations influence the resulting estimate. A smaller bandwidth produces a more detailed result, while a larger bandwidth creates greater smoothing. In both cases, the goal is to transform noisy, individual observations into a smoother representation that is easier to interpret.
The main similarities can be summarized as:
- Kernels: Both use kernel functions to determine how observations contribute.
- Distance-based weighting: Nearby observations generally have greater influence.
- Bandwidth: The bandwidth strongly affects the resulting curve.
- Smoothing: Both produce smoother estimates than looking at raw observations alone.
However, their purposes differ. KDE is specifically a density-estimation technique, designed to estimate the distribution of data. Kernel smoothing is a broader framework for estimating an underlying signal or relationship from noisy observations.
5. Limitations of KDE in Trading
Kernel Density Estimation can provide useful insights into the distribution of market data, but traders should understand its limitations before using it for analysis or developing trading signals.
KDE Is Descriptive, Not Predictive by Itself
KDE describes how historical observations are distributed; it does not automatically predict what price will do next. A high-density area indicates where observations have frequently occurred in the past, but it is not a guarantee that future prices will return to that area.
Bandwidth Can Change the Interpretation
Bandwidth has a significant effect on the resulting density curve. A small bandwidth may reveal many peaks and fluctuations, while a large bandwidth can smooth them away. Choosing an inappropriate bandwidth can therefore lead to misleading conclusions.
Markets Are Non-Stationary
Financial markets change over time. A distribution estimated from historical data may no longer accurately represent current market conditions, particularly after major changes in volatility, liquidity, or market structure.
Edge Effects
KDE can also produce unreliable estimates near natural boundaries. This can be relevant when analyzing:
- Zero volatility, which cannot fall below zero
- Bounded indicators, which have fixed minimum or maximum values
- Probabilities, which must remain between zero and one
The Curse of Dimensionality
KDE becomes increasingly difficult to estimate accurately as more variables are included. In trading, using many dimensions simultaneously can require substantially more data and computational resources, making the resulting density less reliable.
Conclusion
Kernel Density Estimation offers traders a useful way to understand how market data is distributed without assuming a specific statistical model. While KDE and kernel smoothing both use kernels and bandwidth, their purposes differ: KDE estimates data density, while kernel smoothing extracts an underlying signal. Used carefully, KDE can complement trading analysis by revealing patterns, concentrations, and unusual market behavior.
Also, follow us for all the promotions and other useful topics:
- Facebook: www.facebook.com/craftindicators
- Instagram: www.instagram.com/craftindicators
