
Most traders judge a candlestick by one simple question: Is it bullish or bearish? While candle color provides a quick snapshot of price movement, it doesn't reveal the conviction behind that move. A strong bullish candle can signal aggressive buying pressure, while a weak one may reflect hesitation despite closing higher.
This is where candle strength becomes valuable. Candle strength reveals the quality of a price move, not just its direction. In this guide, you'll learn what candle strength is, why it matters, and how to use it to make more informed trading decisions.
1. What Is Candle Strength?
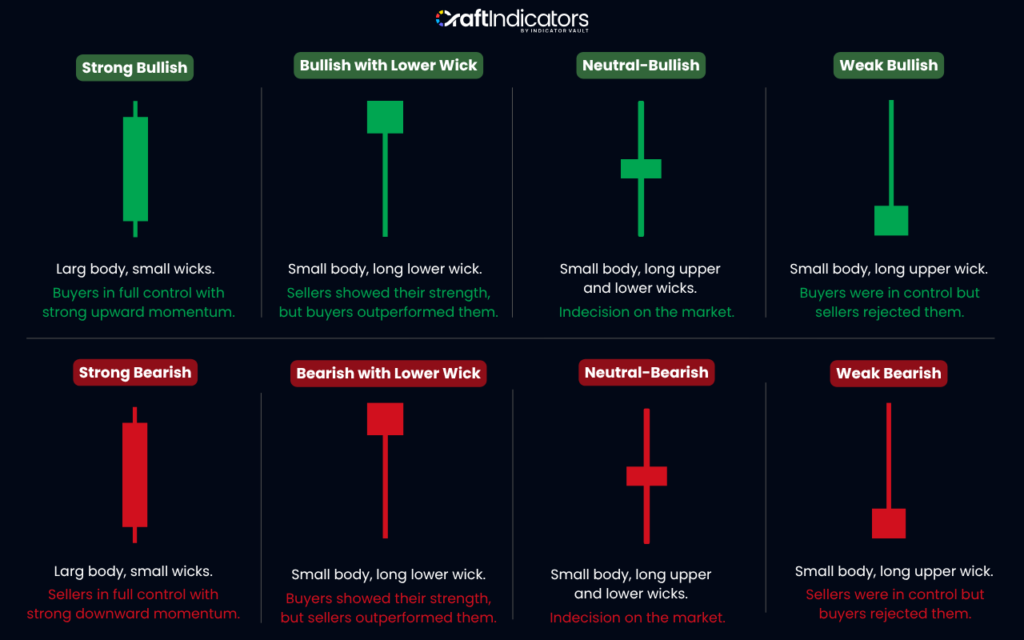
Candle strength is a way of measuring the quality and conviction behind a price move within a single candlestick. Instead of looking only at whether a candle is bullish or bearish, traders analyze the size of the body, the length of the wicks, and where the candle closes within its range. A strong candle typically reflects decisive market participation.
In practical terms, candle strength measures how much conviction exists behind a move. A strong bullish candle suggests buyers controlled most of the session, while a strong bearish candle shows sellers were dominant. This helps traders evaluate buying and selling pressure rather than relying solely on candle color or direction.
Candle strength matters because it provides insight into momentum and trend quality. Strong candles can confirm continuation, while weak candles may signal hesitation, exhaustion, or a potential reversal. By understanding buying and selling pressure, traders can make more informed decisions about entries, exits, and overall market conditions.
2. How to Identify Candlestick Strength
3. Candle Strength vs. Candlestick Patterns
Although they are often used together, candle strength and candlestick patterns measure different aspects of price action.
3.1. Candle Strength
Candle strength measures the conviction behind a single candlestick during a specific trading period. It helps traders evaluate whether buyers or sellers were in control by analyzing the candle's structure rather than simply its direction. Key characteristics include:
- Body Size: Larger bodies generally indicate stronger directional conviction, while smaller bodies suggest weaker momentum.
- Wick Length: Short wicks show little price rejection, whereas long wicks indicate stronger opposition from buyers or sellers.
- Closing Position: A candle that closes near its high (bullish) or low (bearish) reflects sustained buying or selling pressure.
- Overall Momentum: Strong candles often represent decisive market participation, while weak candles may signal indecision or slowing momentum.
3.2. Candlestick Patterns
Candlestick patterns analyze a series of candles to spot potential trend changes. Instead of evaluating one candle's strength, they focus on how a sequence of candles forms recognizable price patterns. Common examples include:
- Engulfing Patterns: Two-candle formations that may indicate a potential trend reversal.
- Morning Star & Evening Star: Three-candle patterns that suggest bullish or bearish reversals.
- Three White Soldiers & Three Black Crows: Multi-candle continuation patterns that reflect sustained buying or selling pressure.
- Doji-Based Patterns: Formations that highlight market indecision and possible changes in direction.
3.3. How Both Concepts Work Together
Candle strength looks at how strong one candle is, while candlestick patterns look at how several candles work together to suggest what the market might do next. A pattern may signal a reversal or trend continuation, but the strength of the individual candles can make that signal more or less reliable.
Using both together gives traders a clearer picture of the market. For example, a Bullish Engulfing pattern made up of large, strong candles is usually more convincing than one made up of small candles with long wicks. By combining candle strength with candlestick patterns, traders can better understand buying and selling pressure and avoid weaker trading signals.
Read More: How to Avoid False Breakouts with Candle Strength Analysis
4. Candle Strength and Market Momentum
Think of market momentum as the force that keeps a trend moving. It usually starts with increasing buying or selling pressure, which creates strong candles and pushes price in one direction. As more traders join the move, the trend develops and often continues until momentum begins to fade.
When momentum is strong, candles tend to have large bodies and small wicks, showing that buyers or sellers controlled most of the trading session. When momentum is weak, candles become smaller, and wicks grow longer, revealing hesitation and a lack of conviction. These changes often suggest that the current trend is losing energy.
Watching how candle strength changes over time can provide valuable clues about market direction. Strengthening candles may confirm a trend continuation, while weakening candles can warn of a pullback or possible reversal. Combining candle strength with overall market context helps traders make more confident trading decisions.
5. Common Mistakes When Reading Candle Strength
Even experienced traders can misread candle strength if they focus on individual candles without considering the bigger picture. Keep these common mistakes in mind before making trading decisions.
- Ignoring context: Always evaluate candle strength within the overall market structure, support and resistance levels, and recent price action.
- Only looking at candle color: A green candle isn't always strong, and a red candle isn't always weak. Body size and wick length matter too.
- Ignoring the trend: Strong candles are more meaningful when they align with the prevailing trend.
- Overreacting to one candle: Wait for additional candles to confirm momentum before making a trading decision.
- Ignoring volatility: High volatility can produce large candles that don't necessarily reflect strong conviction.
- Not waiting for confirmation: Combine candle strength with other technical signals to reduce false entries and improve trade confidence.
6. Can Candle Strength Be Measured Automatically?
For many experienced traders, reading candle strength becomes second nature. They can quickly judge whether a candle reflects strong buying or selling pressure by observing its body, wicks, and closing position. However, this process relies on experience and can be influenced by personal interpretation.
A candle strength indicator simplifies this process by automatically measuring the strength of every candle as it forms. By evaluating characteristics such as body size, wick length, and closing position, the indicator provides an objective view of buying and selling pressure in real time.
This doesn't replace price action analysis; it enhances it. With a clear and consistent measurement of candle strength, traders can spend less time interpreting charts and more time confirming trends, spotting momentum shifts, and managing risk effectively.
7. How Candle Meter for NinjaTrader 8 Helps Measure Candle Strength
Instead of estimating candle strength visually, Candle Meter for NinjaTrader 8 automatically analyzes each candlestick in real time. It evaluates the characteristics of every candle and transforms them into an easy-to-understand strength reading, helping traders monitor bullish and bearish momentum more objectively.
This makes it easier to confirm trends, identify weakening momentum during pullbacks, and recognize potential reversals before they become obvious on the chart. Because the analysis is consistent across every candle, traders can reduce subjective decision-making and gain greater confidence in their market analysis.
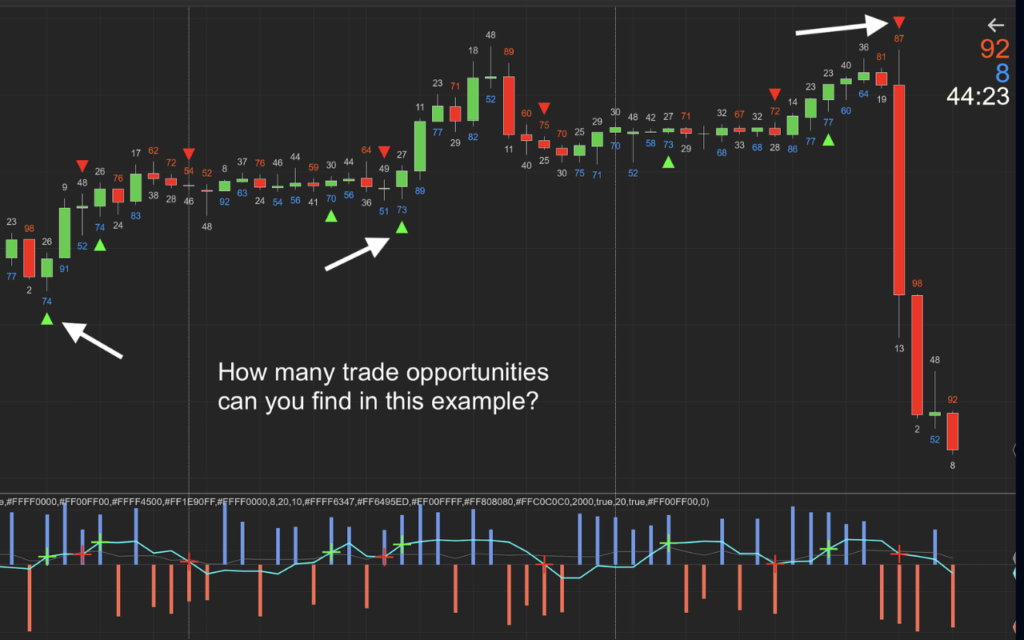
Ready to put candle strength analysis into practice? Download the free version of Candle Meter for NinjaTrader 8 and see how objective candle strength measurements can help you evaluate momentum, confirm trends, and make more informed trading decisions.
Take your trading to the next level with our collection of free indicators for NinjaTrader. They pair well with Candle Meter and provide additional insights for technical analysis.
Conclusion
Learning how to interpret candle strength is an important step toward improving your price action analysis. Rather than focusing solely on candle color or chart patterns, measuring the conviction behind each price move provides valuable insight into momentum and trend quality. Candle strength is only one part of a successful trading strategy. Pair it with other technical analysis methods and proper risk management for better results.
FAQs
1. How do you measure candle strength?
Candle strength is measured by evaluating a candle's body size, wick length, and closing position within its range. Large bodies with small wicks generally indicate strong buying or selling pressure, while small bodies and long wicks suggest weaker momentum.
2. Is candle strength better than RSI?
Not necessarily. Candle strength measures the conviction behind individual candles, while RSI measures momentum based on recent price changes. They complement each other and are often used together to confirm trading signals.
3. Can candle strength predict reversals?
No. Candle strength cannot predict reversals, but it can highlight weakening momentum before a potential trend change. Always use it alongside trend analysis and other confirmation tools.
4. Does candle strength work in all markets?
Yes. Candle strength can be applied to stocks, futures, forex, cryptocurrencies, and other markets that use candlestick charts. The principles remain the same across different timeframes and asset classes.
5. Is candle strength useful for scalping?
Yes. Candle strength helps scalpers identify buying and selling pressure in real time, making it easier to spot momentum and short-term trading opportunities.
6. Can beginners use candle strength?
Absolutely. Beginners can use candle strength to better understand price action and market momentum. As their skills improve, they can combine it with other technical analysis tools for stronger trade confirmation.
Also, follow us for all the promotions and other useful topics:
- Facebook: www.facebook.com/craftindicators
- Instagram: www.instagram.com/craftindicators
