
A price breakout can be hard to resist. When price pushes above resistance or below support, traders often enter immediately, expecting momentum to carry the move further. But a break in price does not always mean strong buying or selling pressure is behind it. Some breakouts quickly reverse, leaving late entries trapped on the wrong side of the market. This is where candle strength analysis can help.
By examining how convincingly a candle breaks and closes beyond a key level, traders can better distinguish genuine momentum from weak breakouts. Learn how to avoid false breakouts with candle strength by using candle strength to filter weaker breakout signals.
1. What Is Candle Strength? A Quick Refresher
Candle strength refers to how strongly a candlestick reflects the control of buyers or sellers during a specific period. Rather than looking only at whether price moved up or down, it considers how convincingly the move occurred. A strong bullish candle, for example, suggests buyers maintained greater control throughout the period, while a weak candle may indicate hesitation or opposing pressure.
This makes candle strength particularly useful when evaluating potential breakouts. It helps traders determine whether price has genuinely pushed through a level with conviction or simply moved beyond it temporarily. In other words, candle strength provides additional context that a simple price break may not reveal.
When assessing candle strength, pay attention to:
- Candle body relative to its range: A larger body often indicates stronger directional pressure.
- Closing position: A close near the candle’s high or low can show stronger control.
- Wicks/rejection: Long opposing wicks may signal rejection and weakening momentum.
- Momentum around important levels: Strong candles at key support or resistance can provide more meaningful breakout clues.
Read More: What Is Candle Strength? The Complete Guide to Candle Strength Trading
2. Why Candle Strength Matters During a Breakout
A breakout occurs when price moves beyond a defined support or resistance level, but the break itself does not guarantee that buyers or sellers have gained enough control to sustain the move. Price can briefly trade beyond the level, trigger entries and stop orders, then quickly return inside the previous range. This is one of the common ways false breakouts develop.
A strong breakout candle provides better evidence of directional conviction. For example, a wide bullish candle that closes near its high above resistance suggests buyers controlled most of the session and were willing to transact at higher prices. The same principle applies to bearish breaks below support.
By contrast, a small-bodied candle, weak close, or prominent rejection wick can signal hesitation, profit-taking, or limited participation. These characteristics don't automatically invalidate a breakout, but they make the setup less convincing.
This leads to an important distinction: breaking a level is not the same as accepting beyond it. A break is simply a price event. Acceptance occurs when subsequent trading holds beyond the level, showing that the market is comfortable establishing value there. Candle strength can help traders evaluate whether that transition is actually taking place.
3. How to Spot a Potential False Breakout Using Candle Strength
3.1. Weak Candle Closing Beyond the Level
A breakout deserves closer attention when price moves beyond a key support or resistance level but fails to close decisively outside it. Instead, the breakout candle may finish with a small body or a noticeable wick, leaving the move only marginally beyond the level.
When assessing the close, pay attention to:
- Small separation from the level: The candle closes only slightly beyond support or resistance.
- Small body: The candle shows limited movement between its open and close.
- Opposing wick: A wick extends back toward the broken level, highlighting intrabar rejection.
- Subsequent price action: The following candles fail to hold above or below the breakout level.
A weak close doesn't automatically invalidate the breakout, but it does provide a reason to wait for further confirmation before treating the move as established.
3.2. Long Wick and Strong Rejection
A long wick around a breakout level can provide an early warning that the move may be failing. When price pushes clearly beyond support or resistance but then retreats before the candle closes, the resulting wick captures that rejection. The candle has tested prices outside the established range without being able to maintain them.
When evaluating this setup, focus on a few details:
- Long wick: The wick extends significantly beyond the candle body, showing a failed move through the level.
- Small body: The candle finishes relatively close to its opening price.
- Close back inside the range: Price returns through the breakout level before the candle closes.
- Volume: Higher-than-usual volume during the rejection can add context to the failed breakout.
Most importantly, wait for the candle to close before judging the rejection. Then check whether the wick formed at a meaningful support or resistance level and look for confirmation from the following price action rather than entering immediately.
3.3. Breakout with No Follow-Through
A breakout candle can look convincing at first, but what happens immediately afterward is often just as important. If the next few candles fail to extend the move, the breakout may be losing momentum.
Look for these signs:
- Limited continuation: Price makes little progress beyond the breakout level.
- Smaller candles: Follow-up candles become noticeably smaller or more indecisive.
- Repeated tests: Price repeatedly returns toward the broken level instead of moving away from it.
- Early reversal: Price starts moving back toward, or even through, the breakout level.
Follow-through matters because a valid breakout should normally show some ability to sustain movement beyond the level. When that continuation is missing, it can be a signal to wait rather than chase the initial breakout.
3.4. Strong Candle in the Wrong Context
Even when a breakout candle looks strong, the broader context still determines whether the move is worth trusting. The surrounding price structure matters just as much. Before treating the move as a potential trade, consider what the candle is breaking into and how price has behaved around the level previously.
Pay particular attention to:
- Nearby resistance/support: A breakout may have limited room if another key level is immediately ahead.
- Trend structure: A breakout against the broader trend may require more confirmation.
- Previous price action: Earlier failed breaks, consolidation, or repeated tests can provide important context.
Think of candle strength as one piece of the setup, not the entire signal. Combining it with market structure and surrounding levels can help you avoid chasing strong candles in poor locations.
4. A Simple Candle Strength Framework for Breakouts
Instead of judging a breakout from a single candle, use a repeatable process to evaluate the setup from the level break through confirmation:
- Step 1: Identify the key level. Mark a meaningful support or resistance area where a breakout could occur.
- Step 2: Wait for the break. Let price move beyond the level rather than anticipating the breakout.
- Step 3: Evaluate the breakout candle. Assess its overall strength and how convincingly it moves through the level.
- Step 4: Check the close and wicks. Look at where the candle closes and whether there is significant rejection.
- Step 5: Watch the next candle. Look for follow-through and whether price can hold beyond the broken level.
- Step 6: Make the decision. If the breakout shows sufficient confirmation and fits the broader setup, consider the trade. If not, waiting for a better opportunity may be the smarter choice.
5. Strong Breakout vs. False Breakout: What to Look For
| Characteristic | Strong Breakout | Potential False Breakout |
| Breakout Candle | Decisive move beyond the key level | Price briefly moves beyond the level but struggles to hold |
| Candle Body | Relatively large body with clear directional movement | Small or indecisive body |
| Closing Position | Closes convincingly beyond support/resistance | Closes close to or back inside the broken level |
| Wicks | Limited rejection against the breakout direction | Long opposing wick shows rejection |
| Follow-Through | Subsequent candles continue in the breakout direction | Price stalls, reverses, or returns toward the level |
| Price Acceptance | Price remains and trades beyond the broken level | Price quickly moves back into the previous range |
| Market Context | Aligns with trend, structure, and available room to move | Runs into nearby support/resistance or conflicts with market structure |
| Trading Signal | More evidence supports waiting for or considering an entry | Greater reason to wait for confirmation or avoid the setup |
6. Common Mistakes When Using Candle Strength
Even with a clear framework, traders can reduce its effectiveness by making a few common mistakes. The most frequent error is entering immediately after price breaks a key level without waiting to see how the breakout candle closes. Another is treating one strong-looking candle as guaranteed confirmation, even though the move may fail shortly afterward.
To avoid these mistakes, keep the following points in mind:
- Don't enter immediately after every level is broken.
- Don't rely on one candle as proof that the breakout will continue.
- Check the closing position, not just the intrabar move.
- Consider the higher-timeframe context before acting.
- Wait for follow-through from subsequent candles.
- Use candle strength alongside market structure, not as a standalone signal.
A structured approach helps traders remain patient and evaluate the entire setup rather than reacting to the first sign of a breakout.
Free Offer: Candle Meter Indicator for NT8
Knowing what to look for is one thing; applying the same analysis consistently while the market is moving quickly is another. During a breakout, traders may need to assess the candle's strength, closing position, rejection, and follow-through within a matter of seconds. This can make it easy to overlook important details or react too quickly to the initial price move.
That's where a Candle Meter Indicator for NT8 can help. Instead of manually judging every candle, the indicator provides a visual reference for candle strength directly on your NinjaTrader 8 chart. It helps you see the current balance between bullish and bearish pressure, making it easier to incorporate candle strength into your breakout analysis.
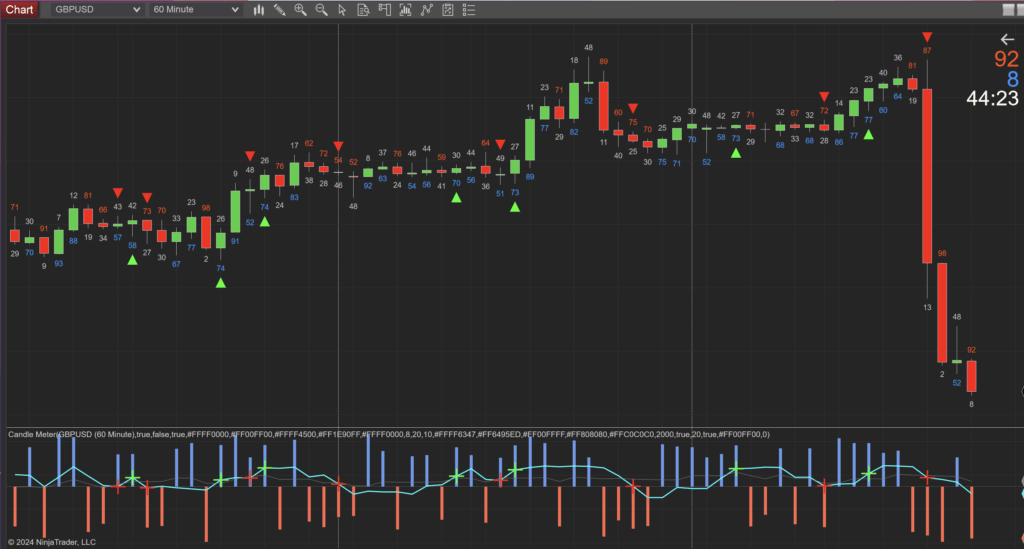
Candle Meter can be particularly useful when applying the framework discussed in this article. Rather than relying solely on whether price has crossed a support or resistance level, you can use the candle-strength reading as an additional piece of information when evaluating the quality of the move.
The indicator also provides additional context, including moving averages for identifying the broader trend and information about the current candle's strength and remaining time before it closes. This can help you avoid making a decision based solely on an incomplete candle.
Of course, Candle Meter isn't designed to predict every breakout or replace market structure analysis. Think of it as a supporting tool that can make candle-strength analysis easier to monitor and apply consistently.
And the best part? It's free.
If you're using NinjaTrader 8 and want a simple way to incorporate candle strength into your breakout analysis, you can learn more about the Free Candle Meter for NT8 here:
Get the Free Candle Meter for NT8 →
Final Thoughts
The goal isn't to predict every winning breakout or avoid every losing trade. Instead, it's about improving the quality of your decisions. By analyzing candle strength alongside key levels and market context, you can better distinguish between genuine momentum and potential traps, helping you approach breakouts with greater confidence and consistency.
Also, follow us for all the promotions and other useful topics:
- Facebook: www.facebook.com/craftindicators
- Instagram: www.instagram.com/craftindicators
