

Price direction is only part of the story. To understand whether a move has conviction, traders can analyze candle strength as an indication of buying pressure and selling pressure. A bullish candle may close higher but still show limited momentum, while a bearish candle can signal strong selling pressure.
Knowing how to use candle strength can therefore provide useful context for identifying trend continuation, evaluating pullbacks, and detecting potential trend reversals. This article breaks down how candle strength behaves in each scenario and how to interpret changes in candle momentum.
1. What is Candle Strength?
1.1. Understanding Candle Momentum
Candle momentum refers to the strength and conviction behind a price move. It helps traders understand whether buyers or sellers are actively pushing the market or whether price is moving with limited participation. Three candle characteristics are particularly useful:
- Body size: A large body can indicate stronger directional momentum, while a small body may suggest limited conviction.
- Closing position: A close near the high or low shows that buyers or sellers maintained control toward the end of the candle.
- Wicks: Long wicks can signal rejection and reveal that the opposing side stepped in before the candle closed.
Strong candles can reflect aggressive participation, while weak candles may point to hesitation or declining momentum. Together, these clues provide a more complete view of market pressure.
1.2. What Makes a Candle Strong?
Candle strength comes from a combination of size, closing position, and the amount of rejection within the candle. The goal is to determine whether buyers or sellers are moving price with conviction.
- Large body: A larger-than-usual body suggests stronger directional momentum.
- Strong closing position: Closing near the high or low shows that the dominant side held control into the close.
- Limited opposing wick: A short wick indicates relatively little rejection from the opposite side.
- Range expansion: A wider candle range compared with recent candles can signal increasing momentum.
- Stronger than surrounding candles: A candle that clearly exceeds nearby candles in size and movement deserves more attention.
Together, these characteristics can help traders distinguish genuine momentum from ordinary price fluctuations.
1.3. Strong Doesn't Always Mean Bullish
A strong candle simply means that price moved with conviction, it does not automatically mean the market is bullish. A strong bullish candle generally reflects strong buying pressure, while a strong bearish candle indicates aggressive selling pressure. The key question is: strong relative to what? A large bullish candle may look impressive, but its significance can change depending on the candles around it, the broader trend, and where it forms on the chart.
For this reason, candle strength should always be interpreted within market structure and location. A strong bullish candle at support may carry a different meaning from one appearing directly below major resistance. Context helps determine whether strength supports continuation, signals a pullback opportunity, or warns of a potential reversal.
2. How to Use Candle Strength
2.1. Using Candle Strength to Identify Trend Continuation
What Does Trend Continuation Look Like?
A trend continuation occurs when price maintains its existing direction and market structure remains intact. In an uptrend, buyers continue to produce strong bullish candles and price forms higher highs and higher lows. In a downtrend, strong bearish candles support lower highs and lower lows. At the same time, candles moving against the trend are typically weaker, showing that the opposing side has not taken control.
The Strong Impulse → Weak Pause → Strong Impulse Pattern
A common continuation setup follows a simple sequence: strong trend move → weaker opposing candles → strong continuation candle → trend resumes.
For example, after a strong bullish move, price may pull back with several small bearish candles. If selling pressure weakens and a strong bullish candle appears, it can suggest that buyers are regaining control.
Confirmation Signals
Before considering a continuation, look for:
- A strong close in the trend direction
- A break of a recent swing high or low
- Increasing candle momentum
- Follow-through from subsequent candles
Avoiding Late Entries
A strong candle can confirm momentum, but entering after an already extended move can mean taking on unnecessary risk. Instead of chasing, consider waiting for a pullback and watching how candle strength behaves. A controlled pullback followed by renewed momentum can provide clearer context and a more defined risk level.
2.2. Recognizing Weakening Momentum During Pullbacks
What Is a Pullback?
A pullback is a temporary move against the prevailing trend. In an uptrend, price may move lower for several candles before buyers step back in. In a downtrend, price may rally temporarily before sellers regain control. The key point is that a pullback does not automatically mean a trend reversal.
How Candle Strength Changes During a Pullback
One way to distinguish a healthy pullback is by watching how candle strength changes. As the pullback develops, countertrend momentum may gradually weaken:
- Countertrend candles become smaller.
- Candle bodies may shrink compared with the preceding trend move.
- Momentum begins to decline.
- Trend-direction candles start appearing again.
Strong Trend, Weak Pullback
This creates a useful sequence to watch:
Strong bullish candles → weaker bearish candles → strong bullish confirmation candle
For a bearish trend, the sequence is reversed.
Using Candle Strength for Pullback Confirmation
With Candle Strength, you can compare the strength of the original impulse with the candles forming during the pullback. In a bullish trend, declining bearish momentum can suggest that sellers are losing control. In a bearish trend, declining bullish momentum can indicate weakening buying pressure.
However, weakening momentum alone isn't a trade signal. Use it alongside market structure, key levels, and confirmation to determine whether the pullback is likely to end and the prevailing trend may resume.
2.3. When a Pullback May Be Turning Into a Trend Reversal
Not every pullback develops into a trend reversal. The key is to watch whether opposing pressure remains temporary or begins to take control. In a healthy pullback, the original market structure stays intact and trend momentum eventually returns. A reversal is different: opposing pressure strengthens, important structure breaks, and momentum begins shifting in the opposite direction.
Warning Signs of a Potential Reversal
Several warning signs can suggest that a pullback is becoming more significant:
- Countertrend candles become larger and stronger.
- Candles close decisively against the existing trend.
- Price fails to create a new trend high or low.
- An important swing point is broken.
- Price shows a strong reaction at support or resistance.
Candle Strength + Structure Break
Candle strength becomes more meaningful when combined with market structure. For example, consider an uptrend where bearish candles gradually become stronger. If price then breaks below the previous higher low and bearish momentum continues, the evidence for a potential reversal becomes much stronger.
The key sequence is:
Uptrend → stronger bearish pressure → higher low breaks → bearish follow-through
A single strong bearish candle may simply signal a pullback. When that strength is followed by a structural break and continued selling pressure, however, it provides stronger evidence that the market may be transitioning into a new trend.
2.4. Spotting Potential Trend Reversals With Candle Strength
Candle strength can become especially useful when price reaches important areas such as support, resistance, previous highs or lows, and breakout zones. A strong candle appearing at one of these locations can reveal a potential shift in buying or selling pressure. However, the surrounding price action still matters.
For a bearish-to-bullish reversal, sellers may initially control the market, but their momentum begins to weaken. A strong bullish candle then appears, price rejects support, and market structure starts shifting upward. This combination can suggest that buyers are beginning to regain control.
The opposite can occur during a bullish-to-bearish reversal. Buyers may remain dominant initially, but bullish candles begin losing strength. Strong bearish pressure then appears near resistance, followed by rejection and a potential break in structure.
The important point is not to predict reversals too early. A strong opposing candle is a warning, not proof that the trend has changed. Look for additional confirmation, such as:
- A break of an important swing point
- Continued momentum in the new direction
- Follow-through after the initial signal
- Confirmation around a key price level
Combining candle strength, market structure, and location can provide stronger evidence of a potential reversal than relying on a single candle alone.
Read More: How to Avoid False Breakouts with Candle Strength Analysis
Free Offer: Candle Meter Indicator for NT8
One of the most important ideas in this article is that candle strength can change before the overall market structure changes. For example, an uptrend may still be intact, but bearish candles during the pullback could gradually become weaker or stronger. Watching that change in momentum can provide useful context for what price may be doing next.
Candle Meter for NT8 is designed to make these changes easier to see. Instead of judging candle momentum purely by looking at the chart, the indicator provides a visual reference that helps you recognize when candle strength is increasing or decreasing.
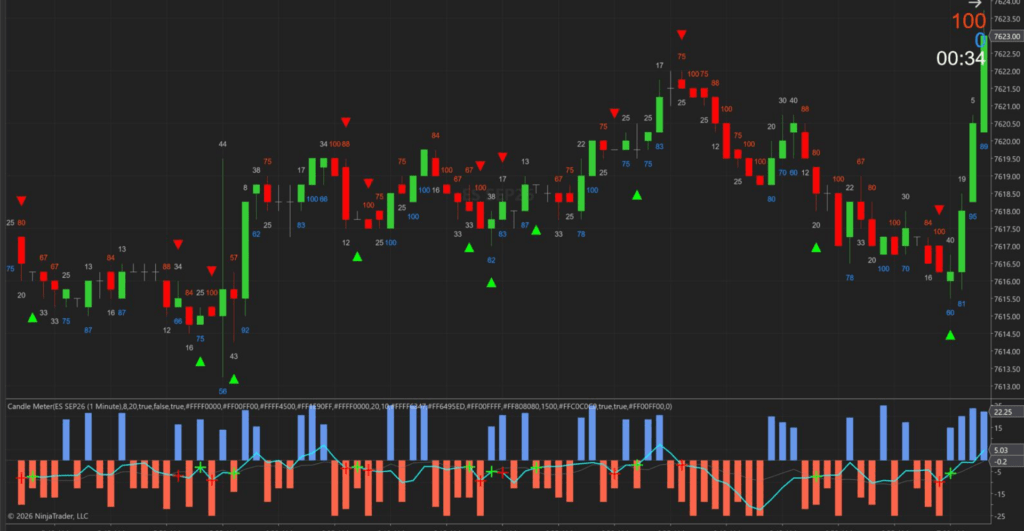
That can be particularly useful when comparing the impulse move with the pullback, or when watching for a shift in pressure that could precede a potential trend reversal.
Try the Free Candle Meter for NT8 →
Enhance your trading toolkit with our collection of free indicators for NinjaTrader. Use them alongside Candle Meter to gain additional insights into market momentum and price action.
Conclusion
Candle strength provides a practical way to understand the balance between buyers and sellers. Strong trend candles can support trend continuation, weakening countertrend candles can help confirm pullbacks, while increasing opposing pressure may warn of trend reversals. By combining candle momentum with market structure and key levels, traders can build a clearer, more structured approach to reading price action.
Also, follow us for all the promotions and other useful topics:
- Facebook: www.facebook.com/craftindicators
- Instagram: www.instagram.com/craftindicators
