Markets move fast. The key is to know how fast. That’s why traders use a momentum indicator. It helps you spot a rising trend or catch a turning point.
In this article, we’ll cover the best momentum indicators that smart traders rely on. You’ll see how they work, what signals they give, and how they help you trade with confidence. Whether you’re new or experienced, these tools can sharpen your edge. Ready to track momentum like a pro? Let’s jump in.
1. What is a Momentum Indicator?
A momentum trading indicator is a tool used in technical analysis to measure the speed of trend changes. It shows how quickly a price is moving. Strong moves often mean strong trends, while slow moves can signal a possible shift.
These tools look at recent price movements and compare its to past data. They don’t predict where the market will go, but they help traders identify if the move is real or just noise. Momentum indicators are useful for finding entry and exit points and keeping trades on the right side of the trend.
2. What Makes a Momentum Indicator the “Best”?
Here are the reasons:
- Spot Trend Strength Early: A good indicator helps traders see if a trend is gaining speed or slowing down. Rising momentum often signals strong buying, while falling momentum may show weakness. This lets traders confirm trend direction and make better entry or exit decisions.
- Identifying Potential Reversals: Momentum tools are great for spotting signs of change. When price and momentum move in opposite ways, it could mean a reversal is near. This helps traders prepare and adjust their strategy in time.
- Overbought and Oversold Conditions: Some indicators show when an asset is too high (overbought) or too low (oversold). These signals help traders act before the market corrects itself.
- Work Across Markets and Timeframes: The best momentum tools work in stocks, crypto, forex, and more. They also suit both short-term and long-term trading styles.
- Easy to Use: Clear charts and simple signals make these tools beginner-friendly. You don’t need advanced skills to spot strong price movements or trend shifts.
Top 5 of the Best Momentum Indicators in Trading
Relative Strength Index (RSI)
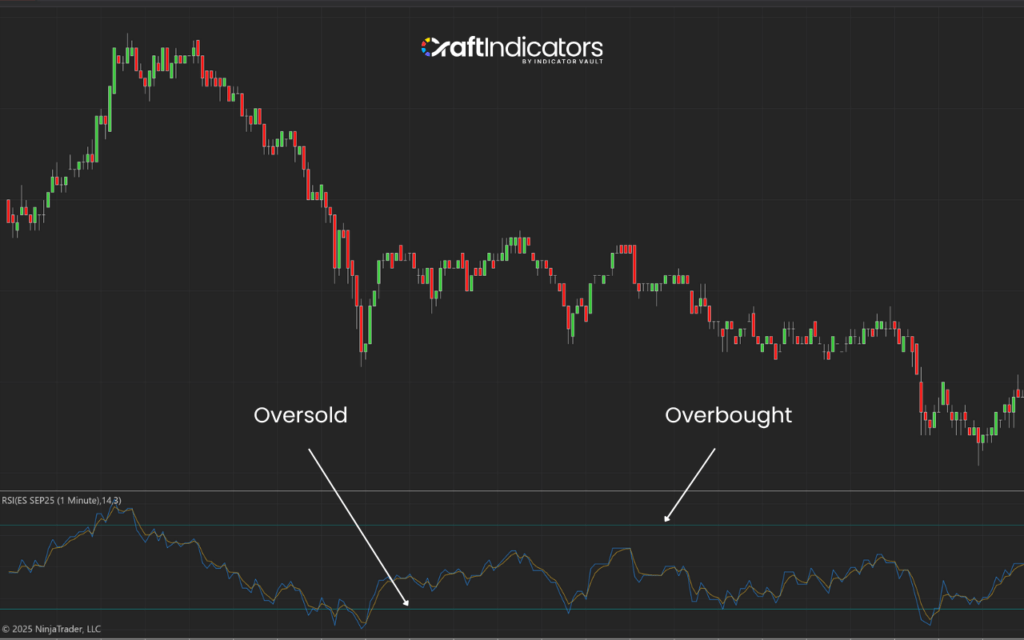
The RSI (Relative Strength Index) is a well-known momentum indicator. It shows how fast the price is moving by comparing recent gains and losses. The default setting looks at the last 14 periods.
RSI is an oscillator that moves between 0 and 100. A reading above 70 may mean the asset is overbought. A reading below 30 may mean it is oversold. Traders often watch for the RSI to move back out of these zones as a possible sign of a reversal. Movements above 50 suggest a bullish trend, while below 50 may signal a bearish one. Some traders also check for divergence between RSI and price to spot weak trends or possible trend changes.
Moving Average
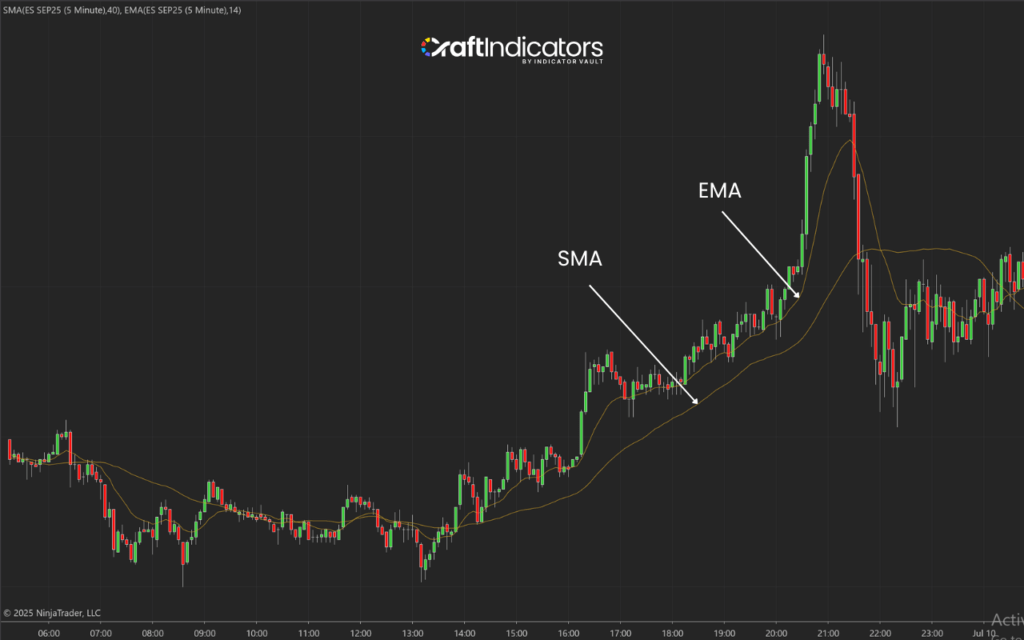
A Moving Average (MA) is used to follow the trend of a market. It does this by showing the average price over time, making it easier to see the market’s direction. The 50-day and 200-day MAs are popular choices.
There are two types: SMA (simple) and EMA (exponential). The EMA reacts more quickly to price changes. Traders use MAs to find support, resistance, and trend signals. If the price stays above the line, the trend may be strong. If it drops below, the trend could be turning. In flat markets, though, moving averages may not work well.
MACD
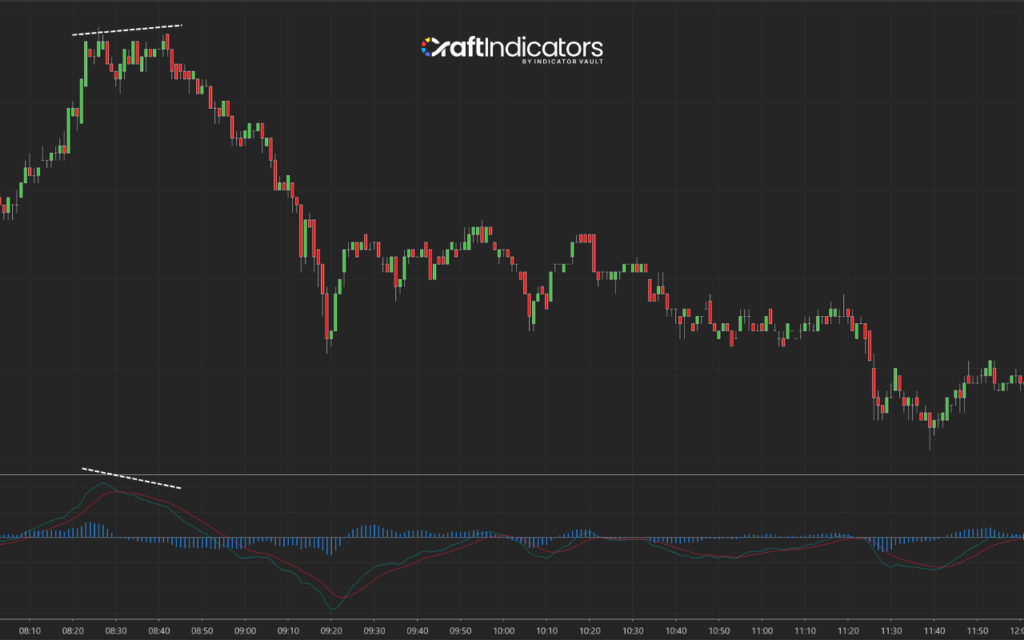
The MACD (Moving Average Convergence Divergence) helps traders spot changes in trend direction. It compares two EMAs (Exponential Moving Averages) and shows when they move closer or farther apart. This tells us if momentum is strong or weak.
The MACD line and the signal line move on the chart. When they cross, traders look for possible trade signals. MACD is good for catching early trend reversals. It’s most useful when the market is clearly moving up or down. In sideways markets, it may confuse traders with false signals. That’s why it’s often used with RSI or volume indicators for better results.
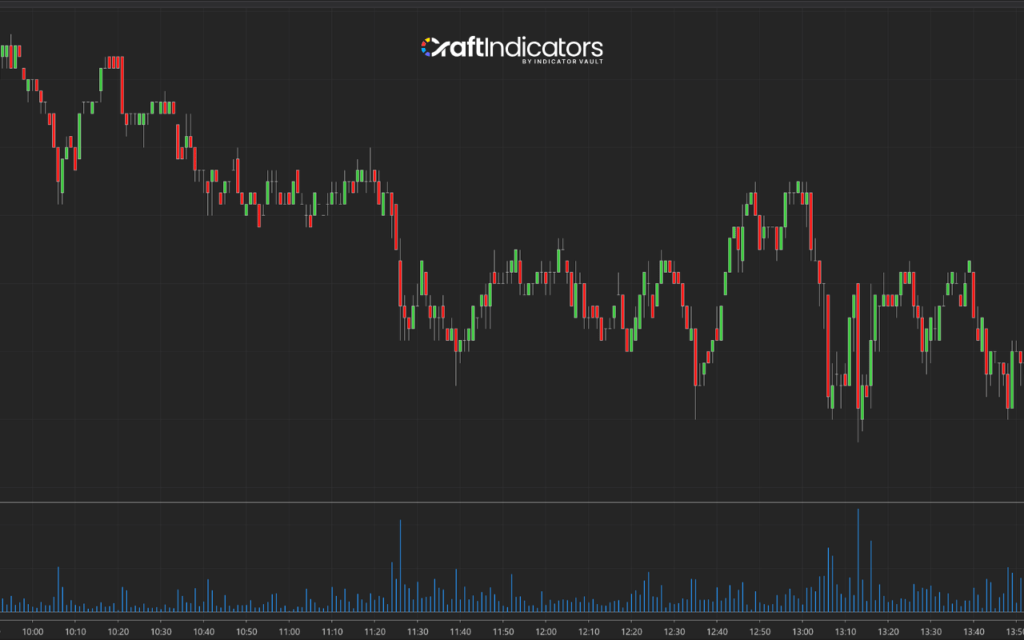
Volume Indicator
The Volume Indicator tells how many shares or contracts are traded in a given time. It shows the strength behind the price movement. If the price goes up with high volume, it may be a strong move. If volume is low, the move may not last.
Volume is useful for spotting breakouts, checking trend strength, or warning of a possible reversal. It works best when paired with trend tools like MACD or RSI. One weakness is that it can give mixed signals in slow markets. Volume doesn’t predict direction, but it shows how strong a move might be.
Bollinger Bands
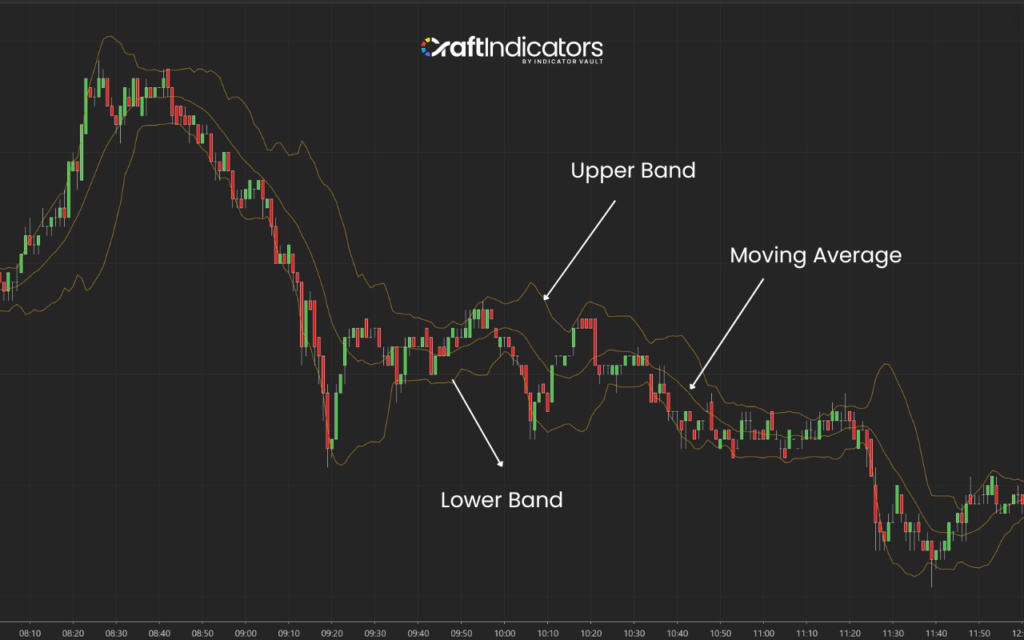
Bollinger Bands is a tool that helps traders see how much the price is moving. The bands include three lines: a middle band (a moving average), and an upper and lower band. These outer bands move wider or tighter based on price volatility. When the bands are wide, the market is active. When they are tight, the market is quiet. Price touching the top band may suggest the asset is overbought. Touching the bottom band may mean it’s oversold.
Bollinger Bands work well in sideways markets. But they may give false signals during strong trends. Traders often use them with other momentum indicators to confirm what the market is doing.
Every indicator works differently. Some fit trends, and others help in sideways markets. For a momentum trading strategy, choose tools that match your trading plan and style.
3. Things to Consider When Using Traditional Momentum Indicators
Momentum indicators can be a powerful part of any trader’s toolkit, but it’s important to understand their limits and the risks that come with using them.
- Lagging Indicators: Momentum indicators often use past price movement. This means they may react slowly to sudden market changes. You might see a signal after the move has already started. It's important to use them with other tools to avoid late entries.
- Choppy or Sideways Markets: In a flat or sideways market, momentum indicators can be less useful. They may show small moves that don’t lead anywhere. This can lead to confusion or poor trade decisions. Wait for a clear trend before trusting the signal.
- False Signals: No tool is perfect. Momentum indicators can give signals that don’t work out. A strong price move might seem real, but then reverse quickly. Always use stop-loss orders and check other signs before acting.
- High Subjectivity: Some momentum tools require judgment. Traders may read the same chart in different ways. This makes signals harder to trust without experience. Practice and simple rules can help you read the data better.
4. Natural Momentum Indicator: A Smarter Alternative to Traditional Momentum
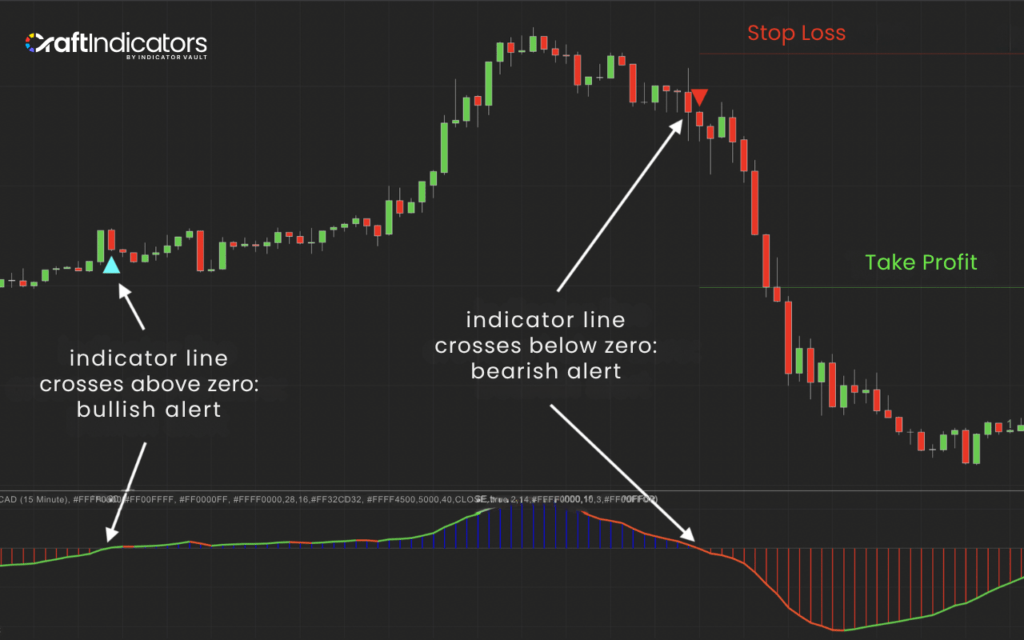
To truly stay ahead of the curb with little or no effort, the Natural Momentum indicator for NinjaTrader is a must-have.
It is one of Craft Indicators’ most complex builds, working with the TEMA (Triple EMA) algorithm for next-level trading and price analysis.
In short, below are the key benefits this indicator provides every trader:
- Knowledge of high-probability trend and reversal trade entries, real-time
- Faster reaction to changing market conditions, thanks to its unmatched formula
- Exposure to the best opportunities, as it weeds out market noise
- Freedom to trade any market in any timeframe
- Timely alerts to ensure traders never miss career-defining moves
- Confirm these and many more benefits by trying it for yourself here today.
Confirm these and many more benefits by trying it for yourself here today.
Conclusion
While momentum indicators offer key insights into market behavior, they are rarely used alone. Traders often pair them with trend-following tools to get a fuller picture. To get the most value, learn how each indicator works and apply it to match your trading goals.
FAQs
1. What is the best momentum indicator for beginners?
The Relative Strength Index (RSI) is a good choice for beginners. It’s easy to read, shows overbought or oversold conditions, and works well in many market situations.
2. Which momentum indicator is most accurate for day trading?
MACD and RSI are both popular for day trading. They give quick signals and help track short-term price movement. Many day traders combine them for better accuracy.
3. What momentum indicator works best in volatile markets?
Bollinger Bands work well in volatile markets. They expand and contract with price swings, helping traders spot breakouts, reversals, and strong momentum changes during high market activity.
4. How do I choose the best momentum indicator for my trading style?
Start by knowing your trading goals and time frame. Test different indicators like RSI, MACD, or Volume. Choose the one that fits how you read trends and manage risk.
5. Can I use multiple momentum indicators together?
Yes, you can use more than one. Many traders combine indicators to confirm signals and avoid false moves. Just keep it simple to avoid confusion or overanalyzing trades.
Don’t forget follow us to get more interesting news as well as great promotions:
Find this article useful? Share this blog with your friends on social media!