Dynamic Bands for NinjaTrader 8
$299.00
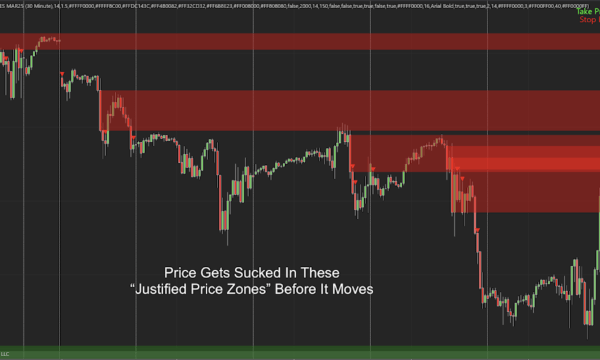
The Dynamic Bands for NinjaTrader 8 is a whipsaw-resistant trend detection indicator that combines a proprietary “Dynamic Moving Average” with ATR-based upper and lower bands to filter out noise. It signals bullish or bearish entries when the price crosses the band boundaries, and also provides suggested stop-loss, take-profit levels, and real-time alerts.
Key features
- Predicts the price is moving up or down

- Gives accurate entry and exit points

- Ignore sideways market and eliminates whipsaw → help you avoid losing money

Add to Cart today to get the Dynamic Bands for NinjaTrader 8 at $299 with instant, lifetime access.