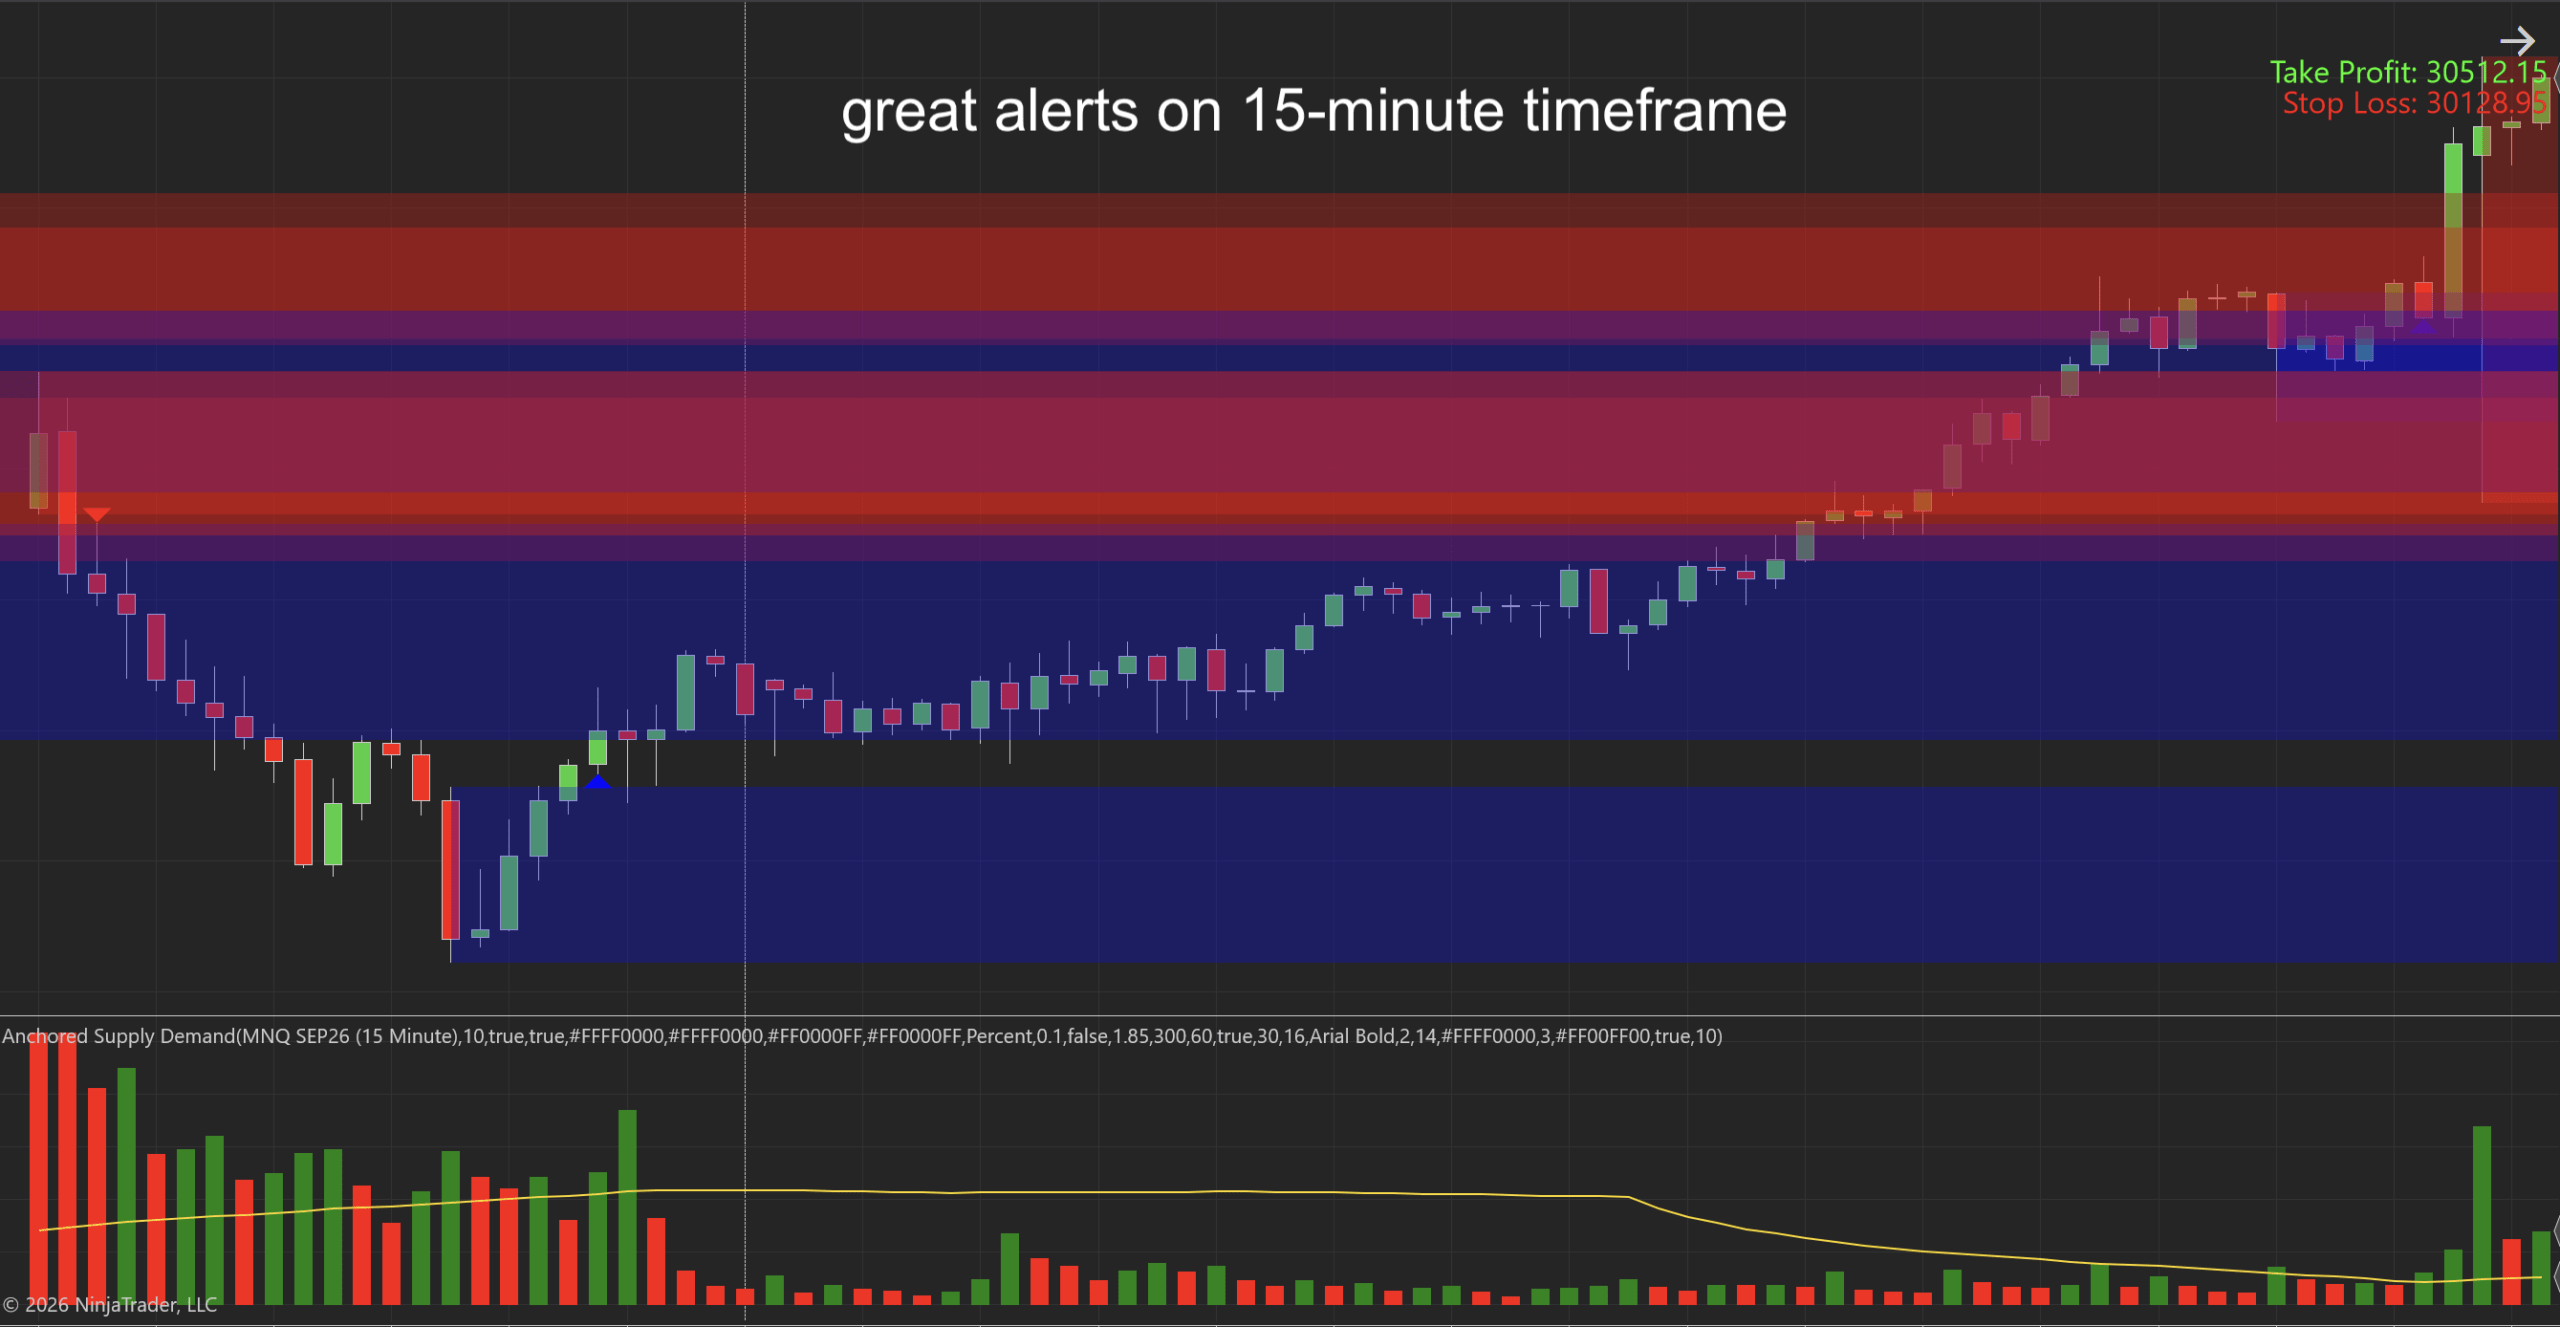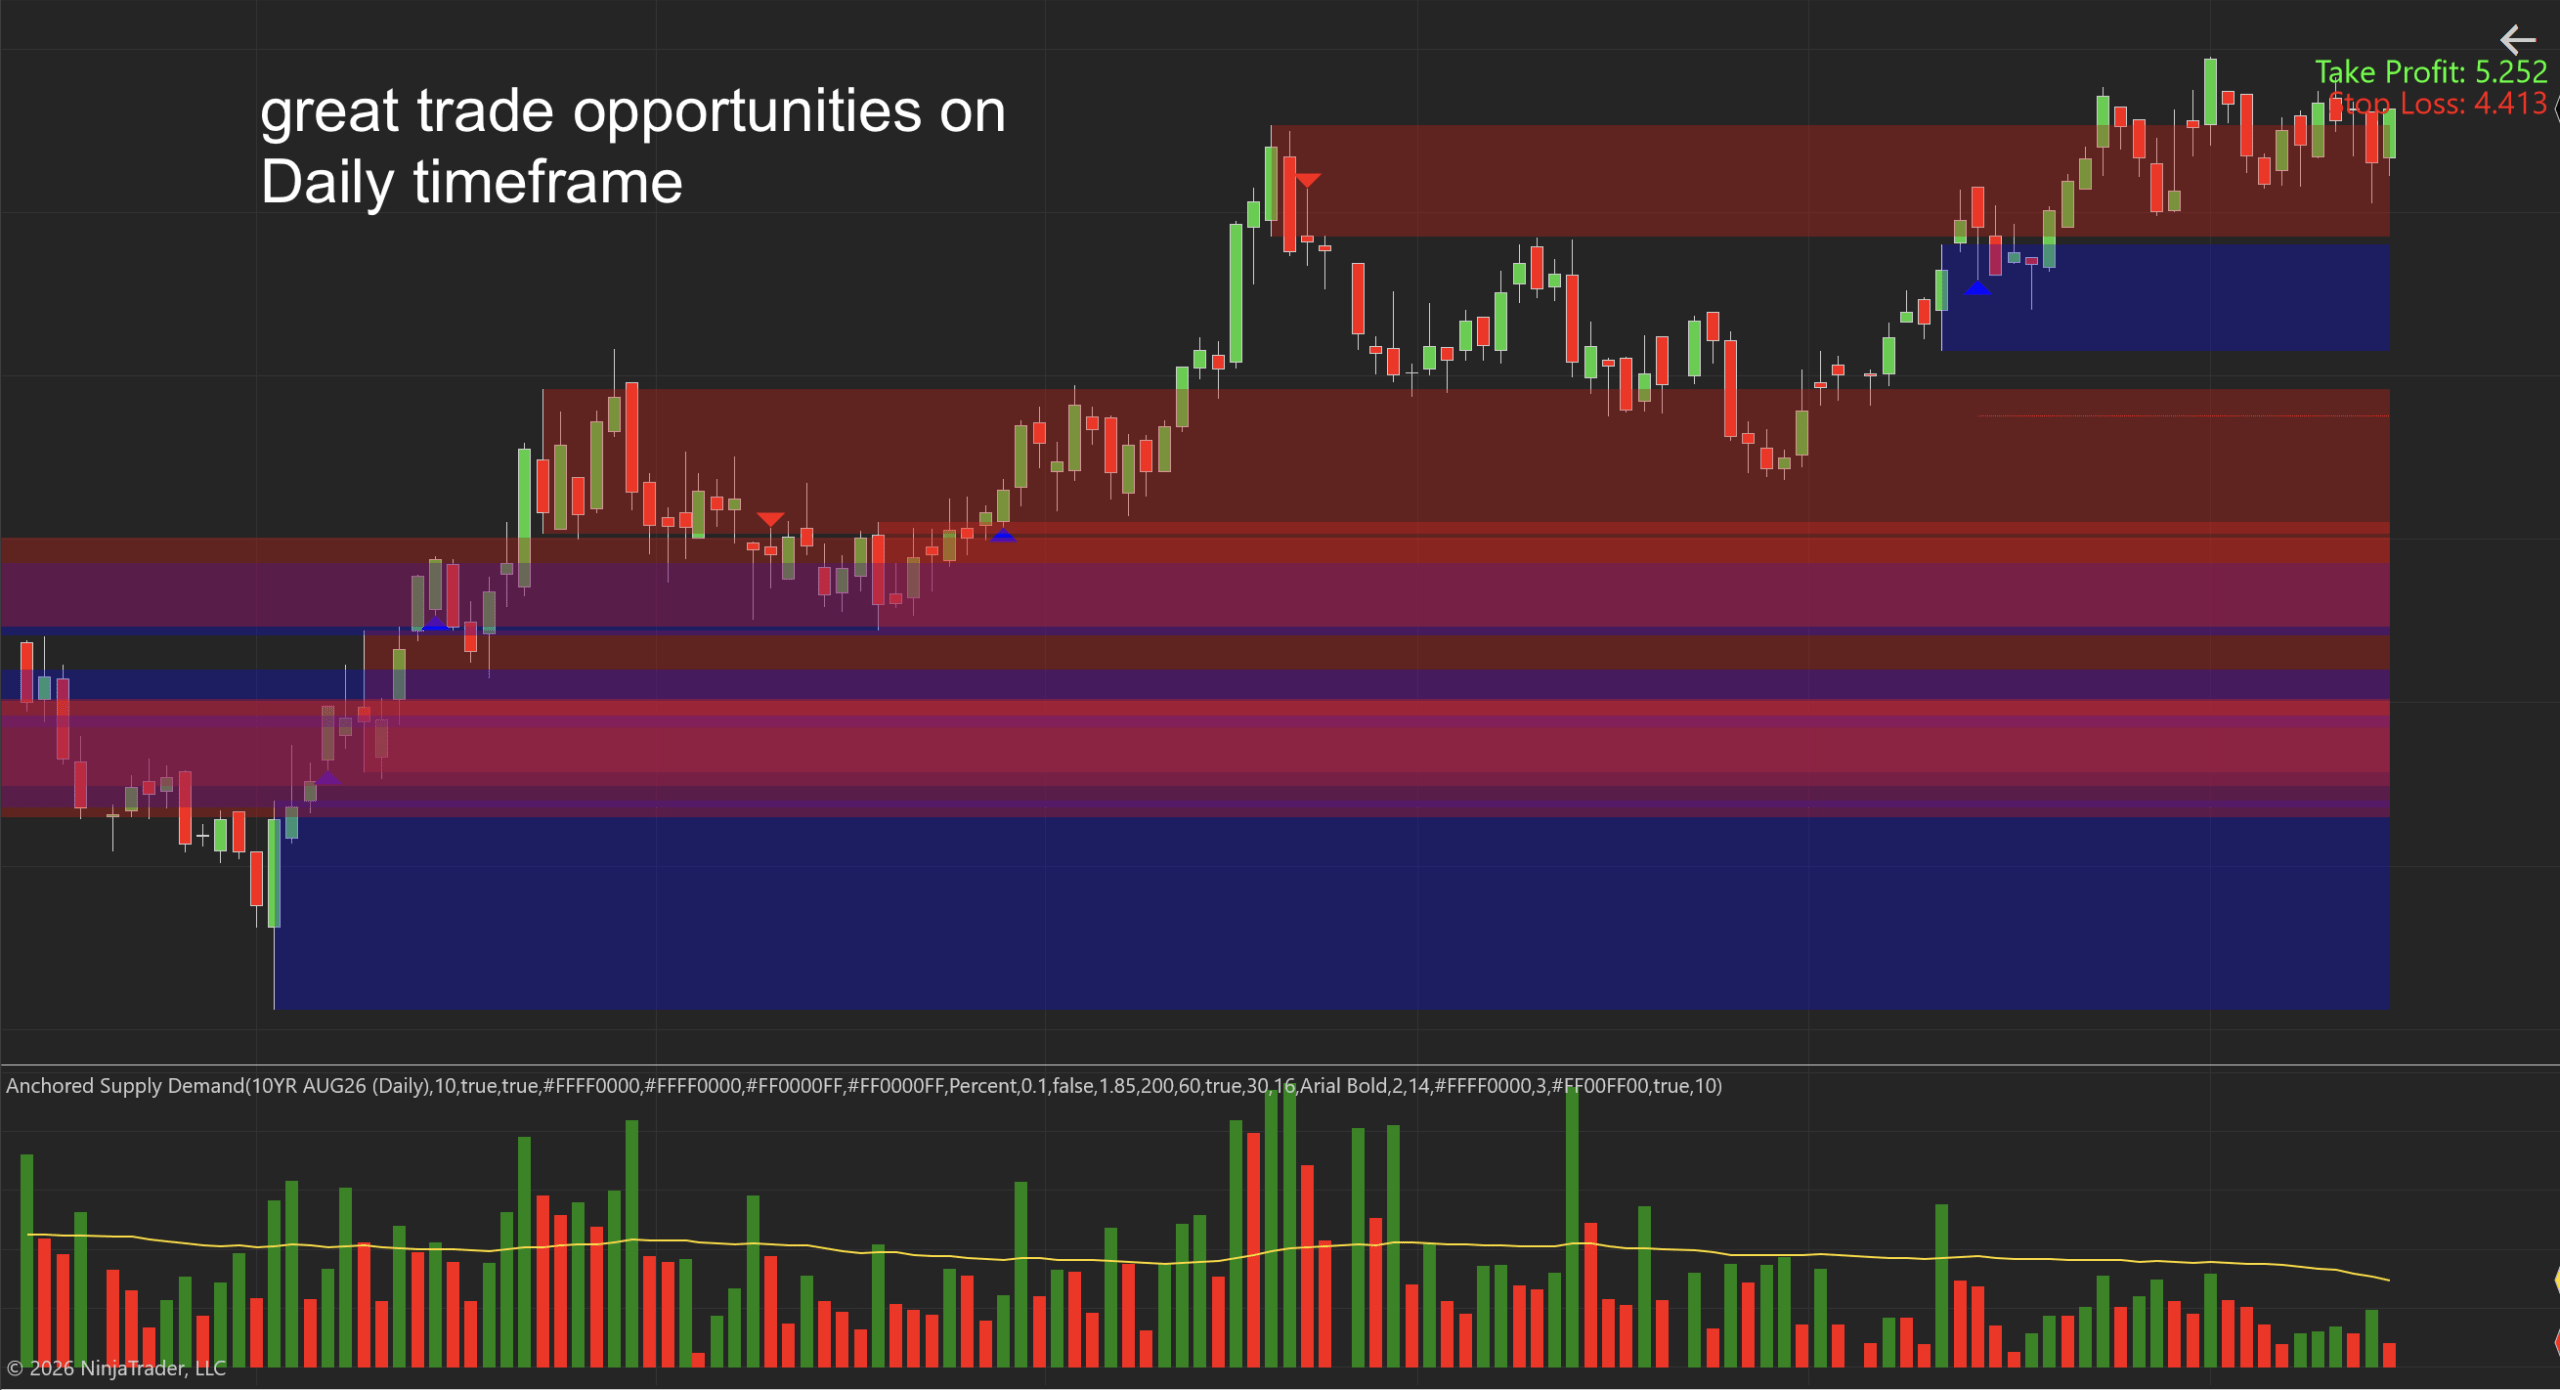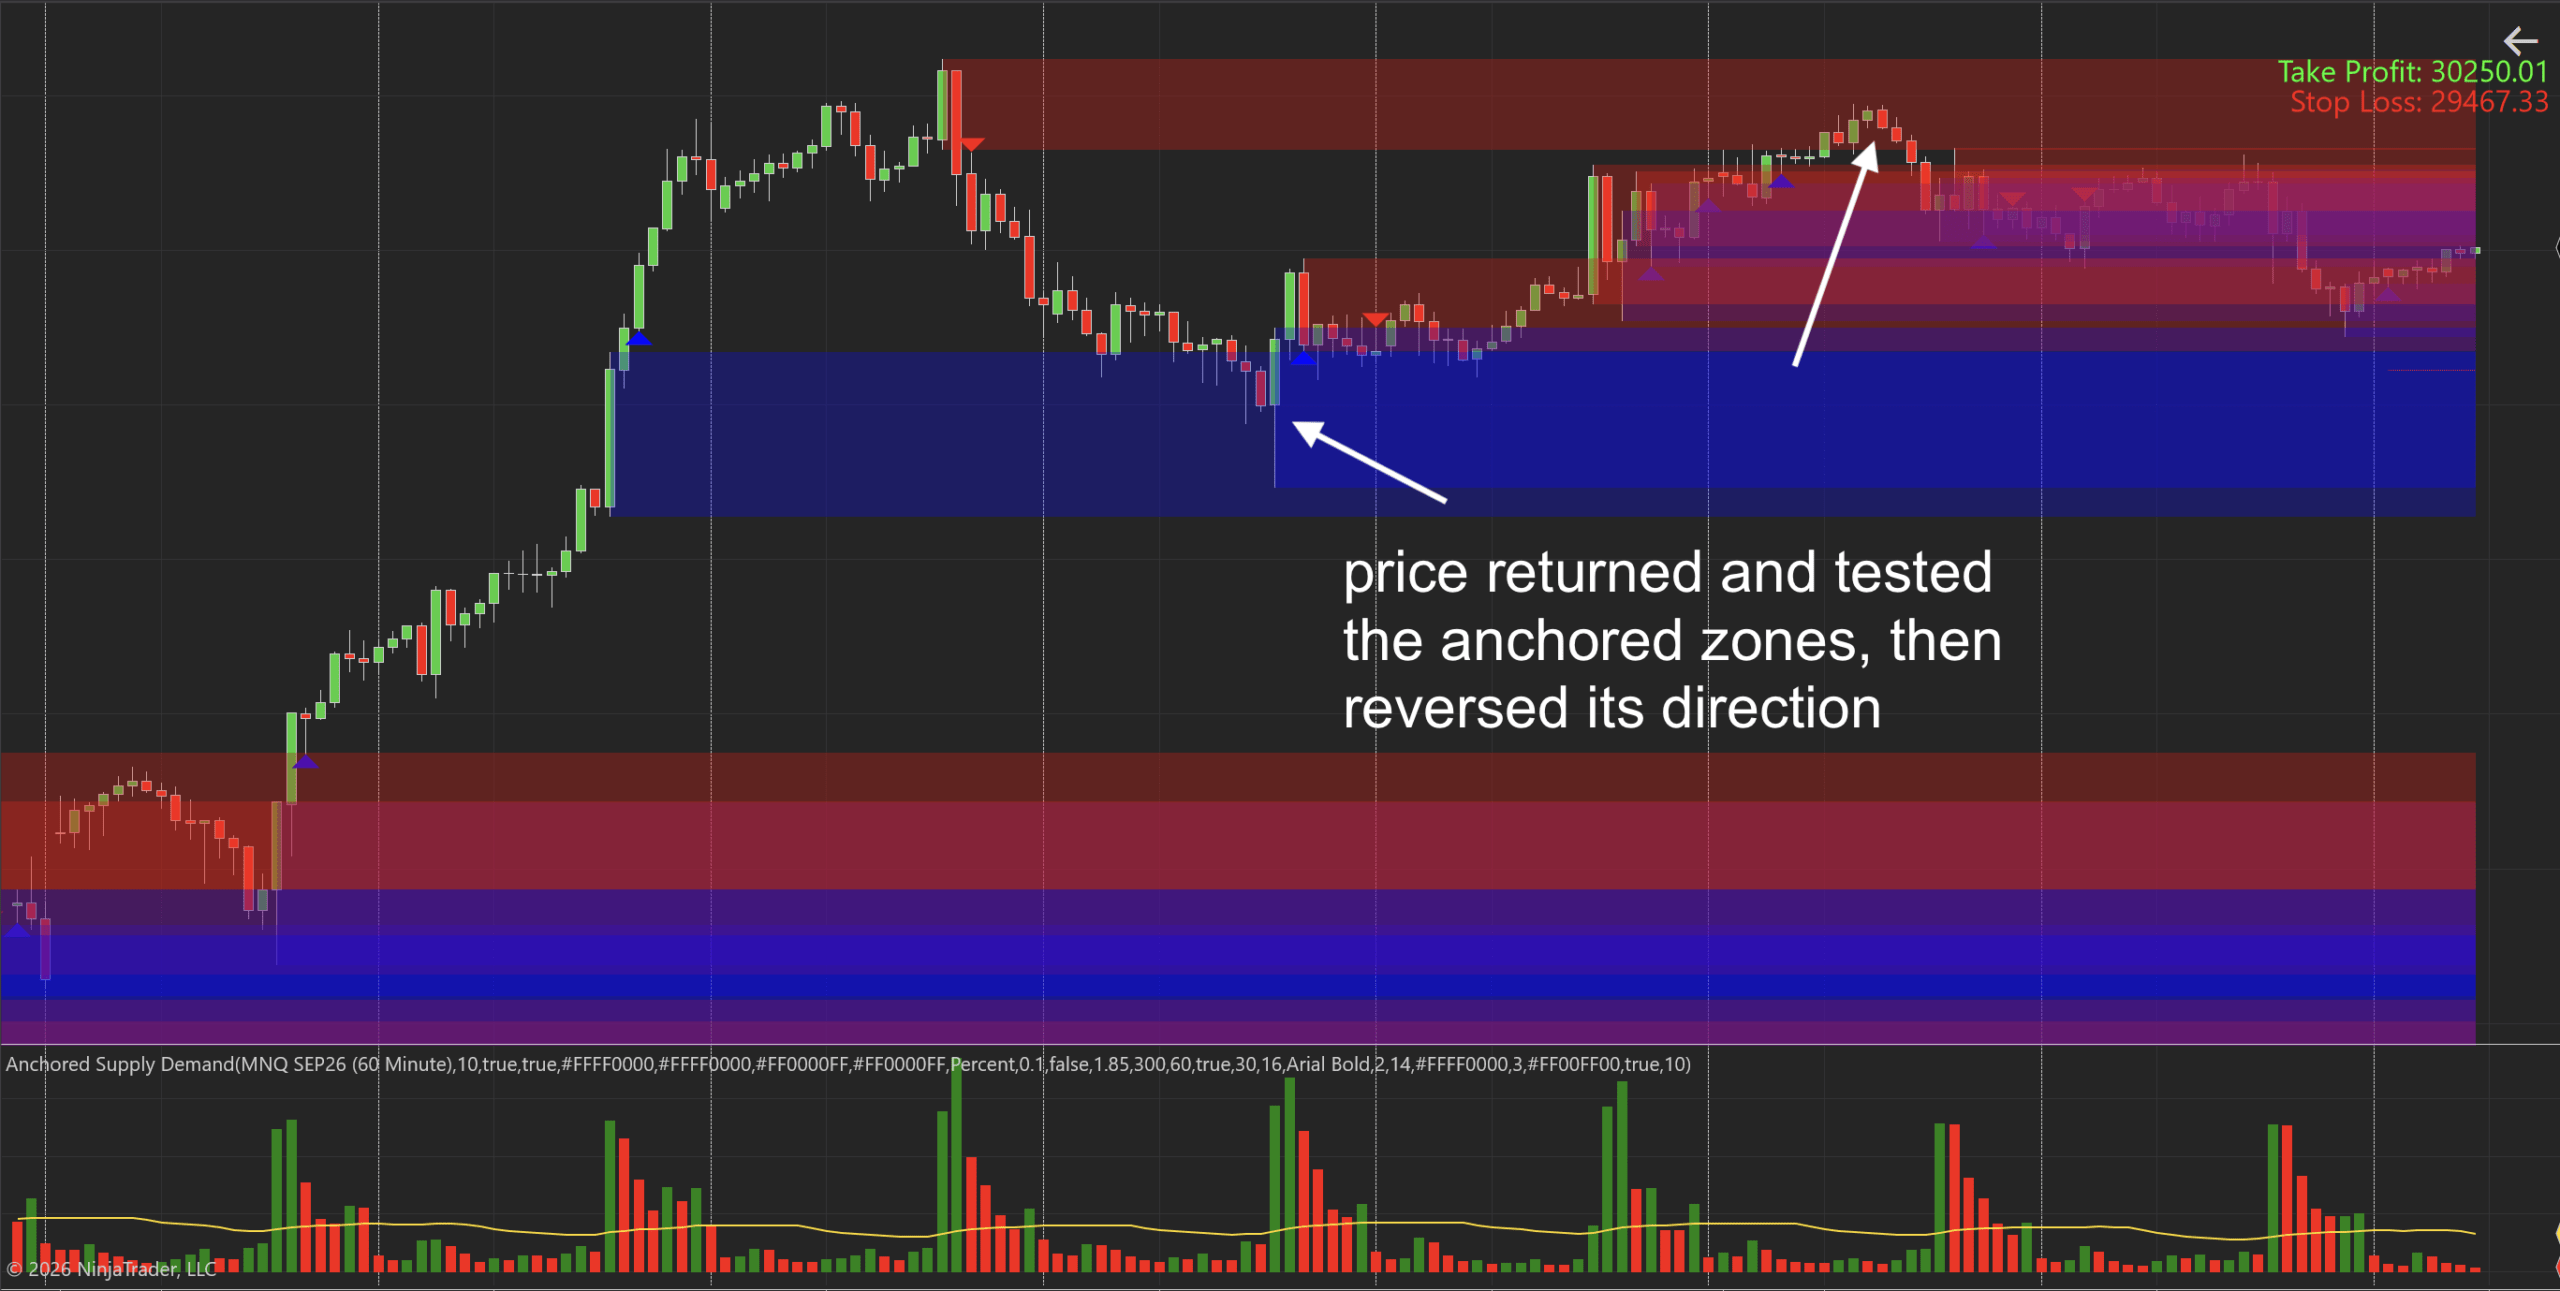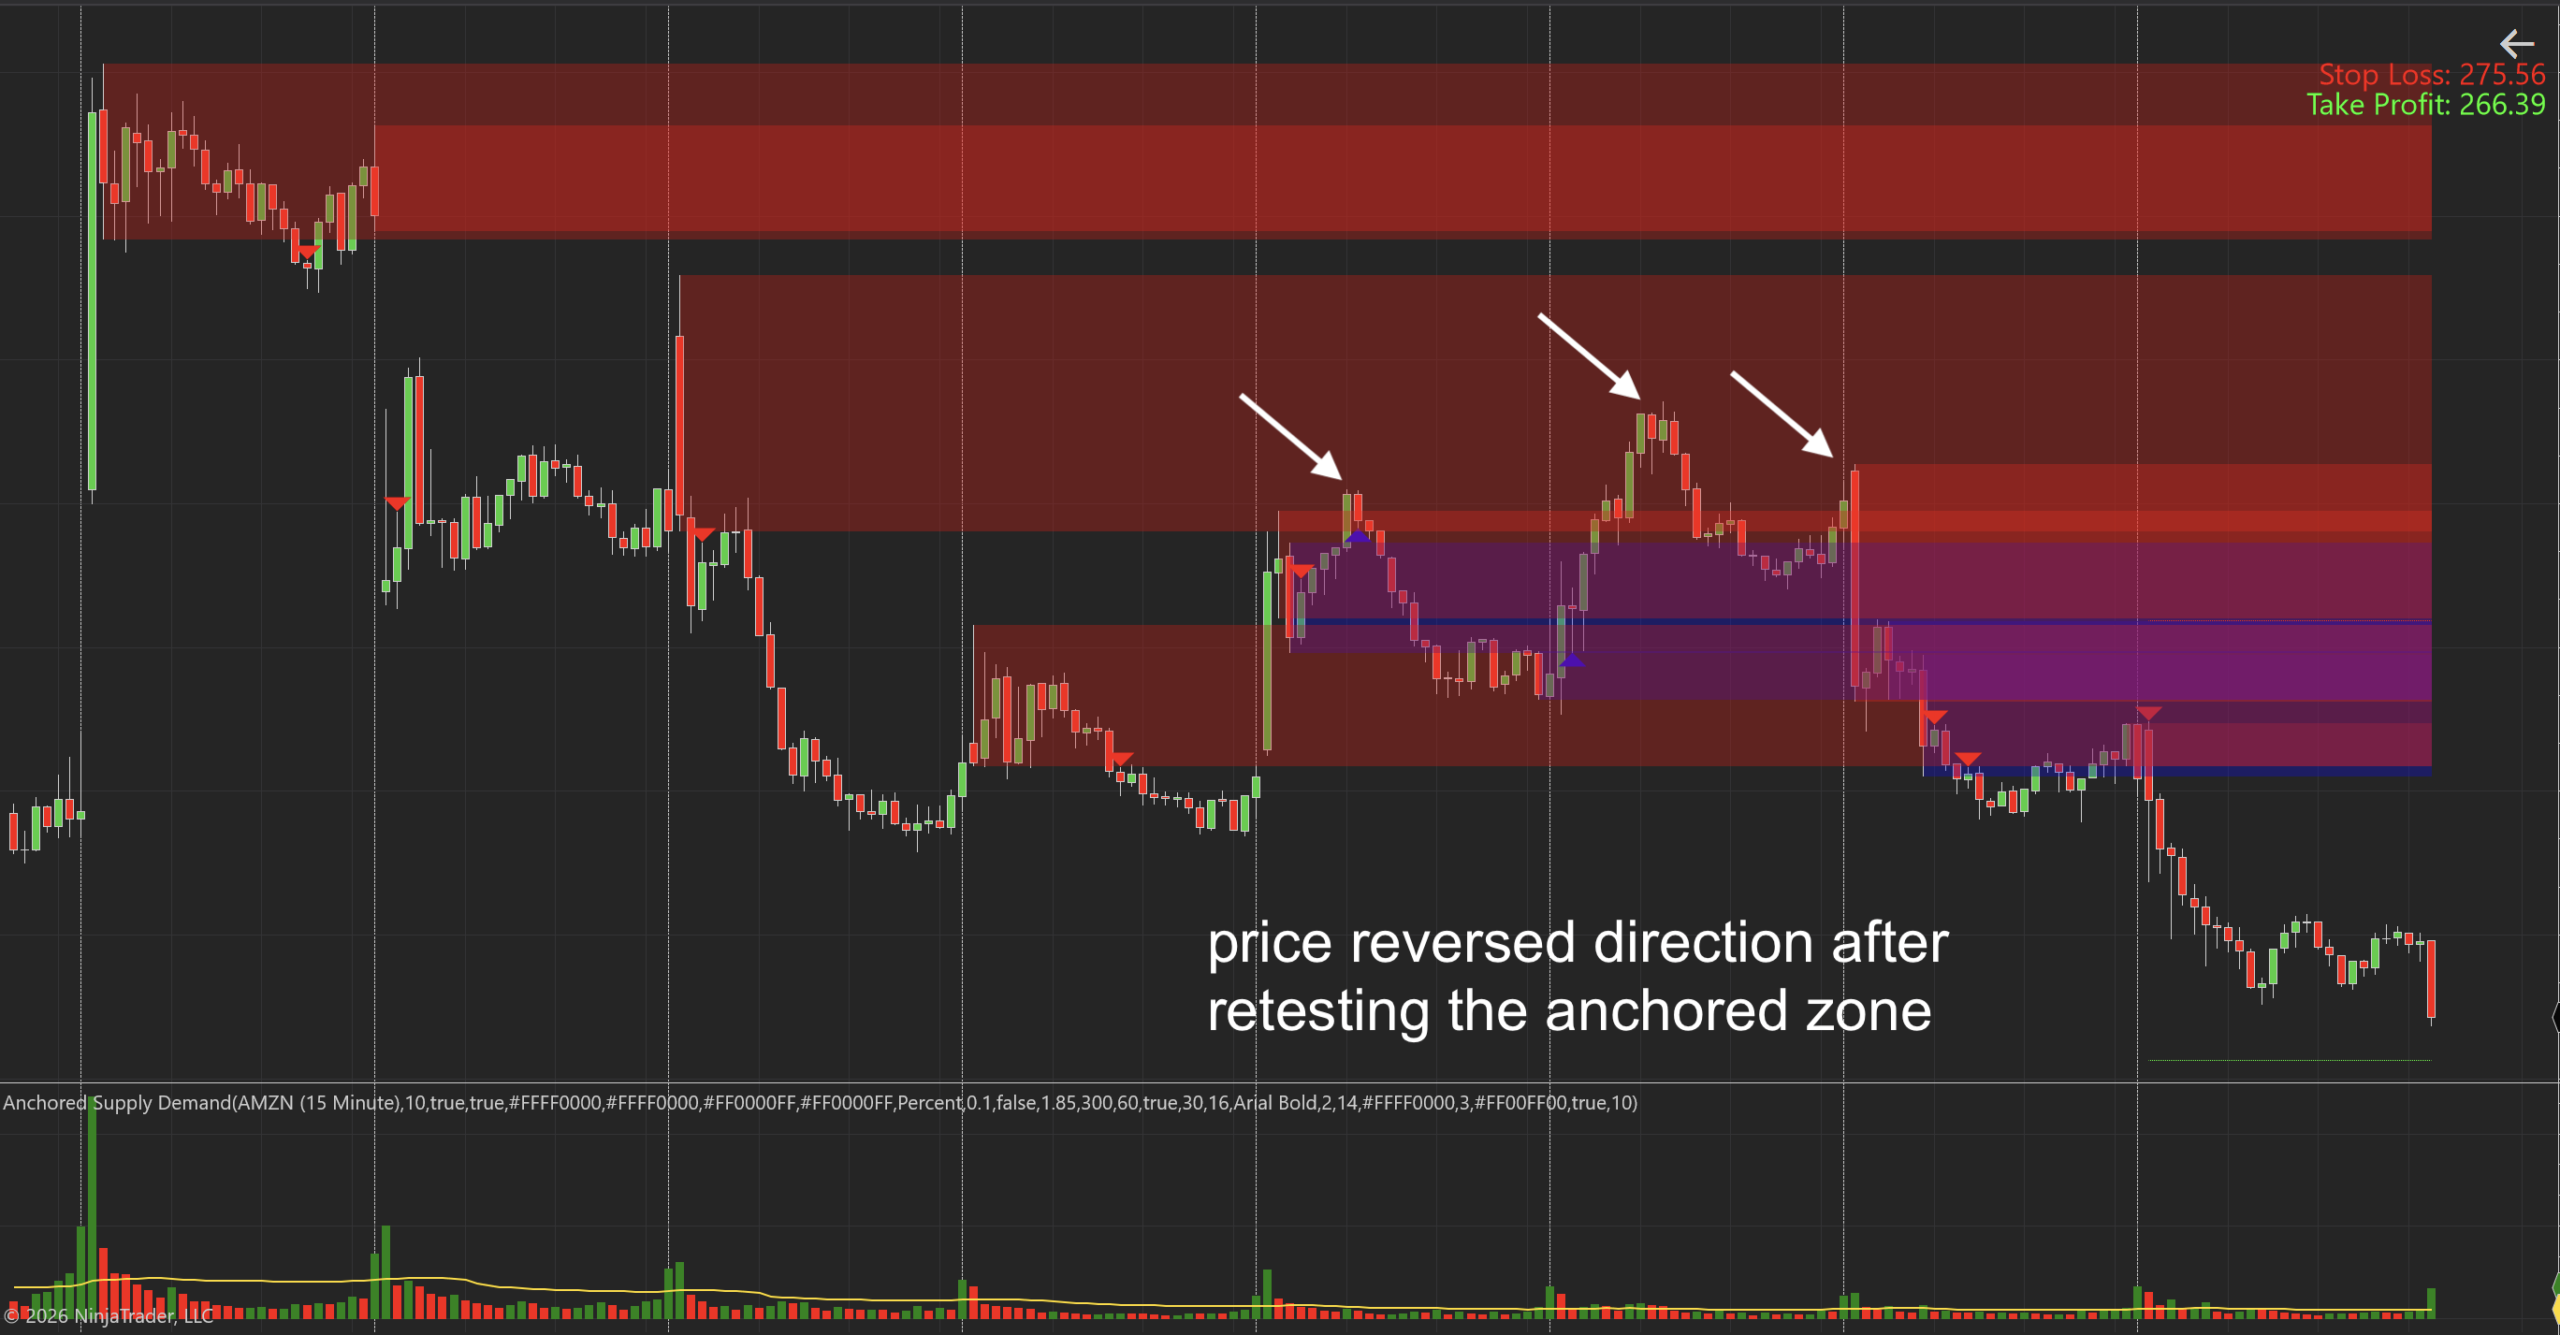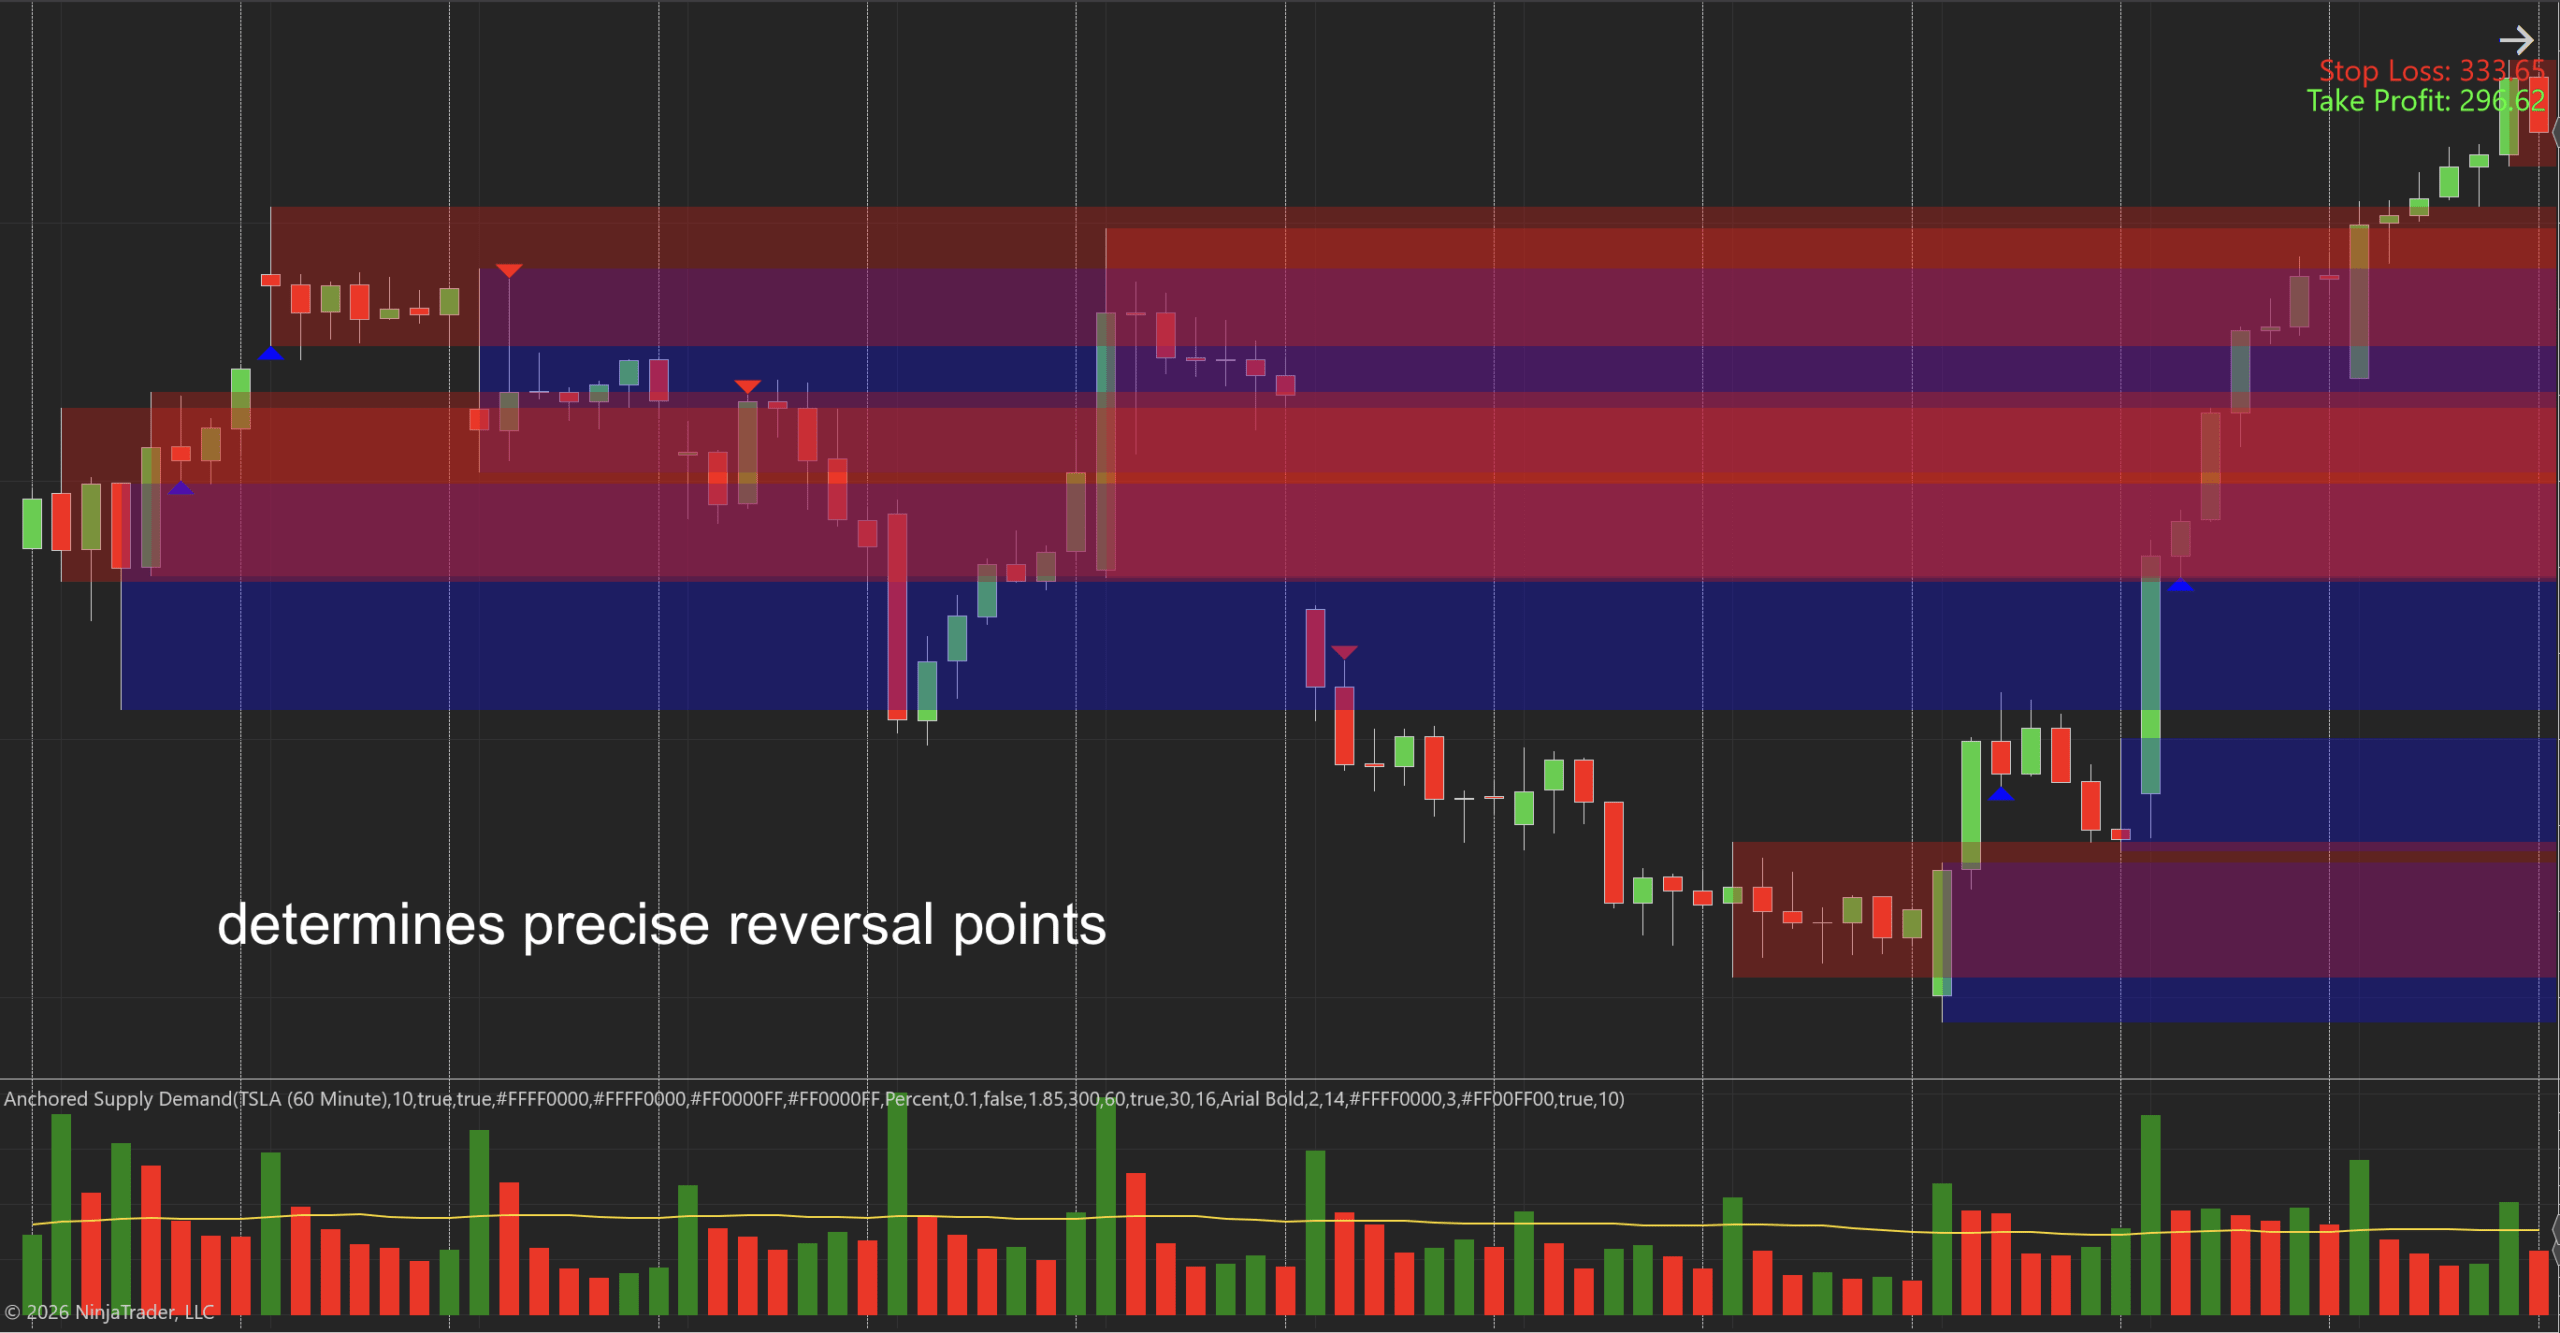
What exactly is this brand-new kind of supply demand zones?
You might be wondering.
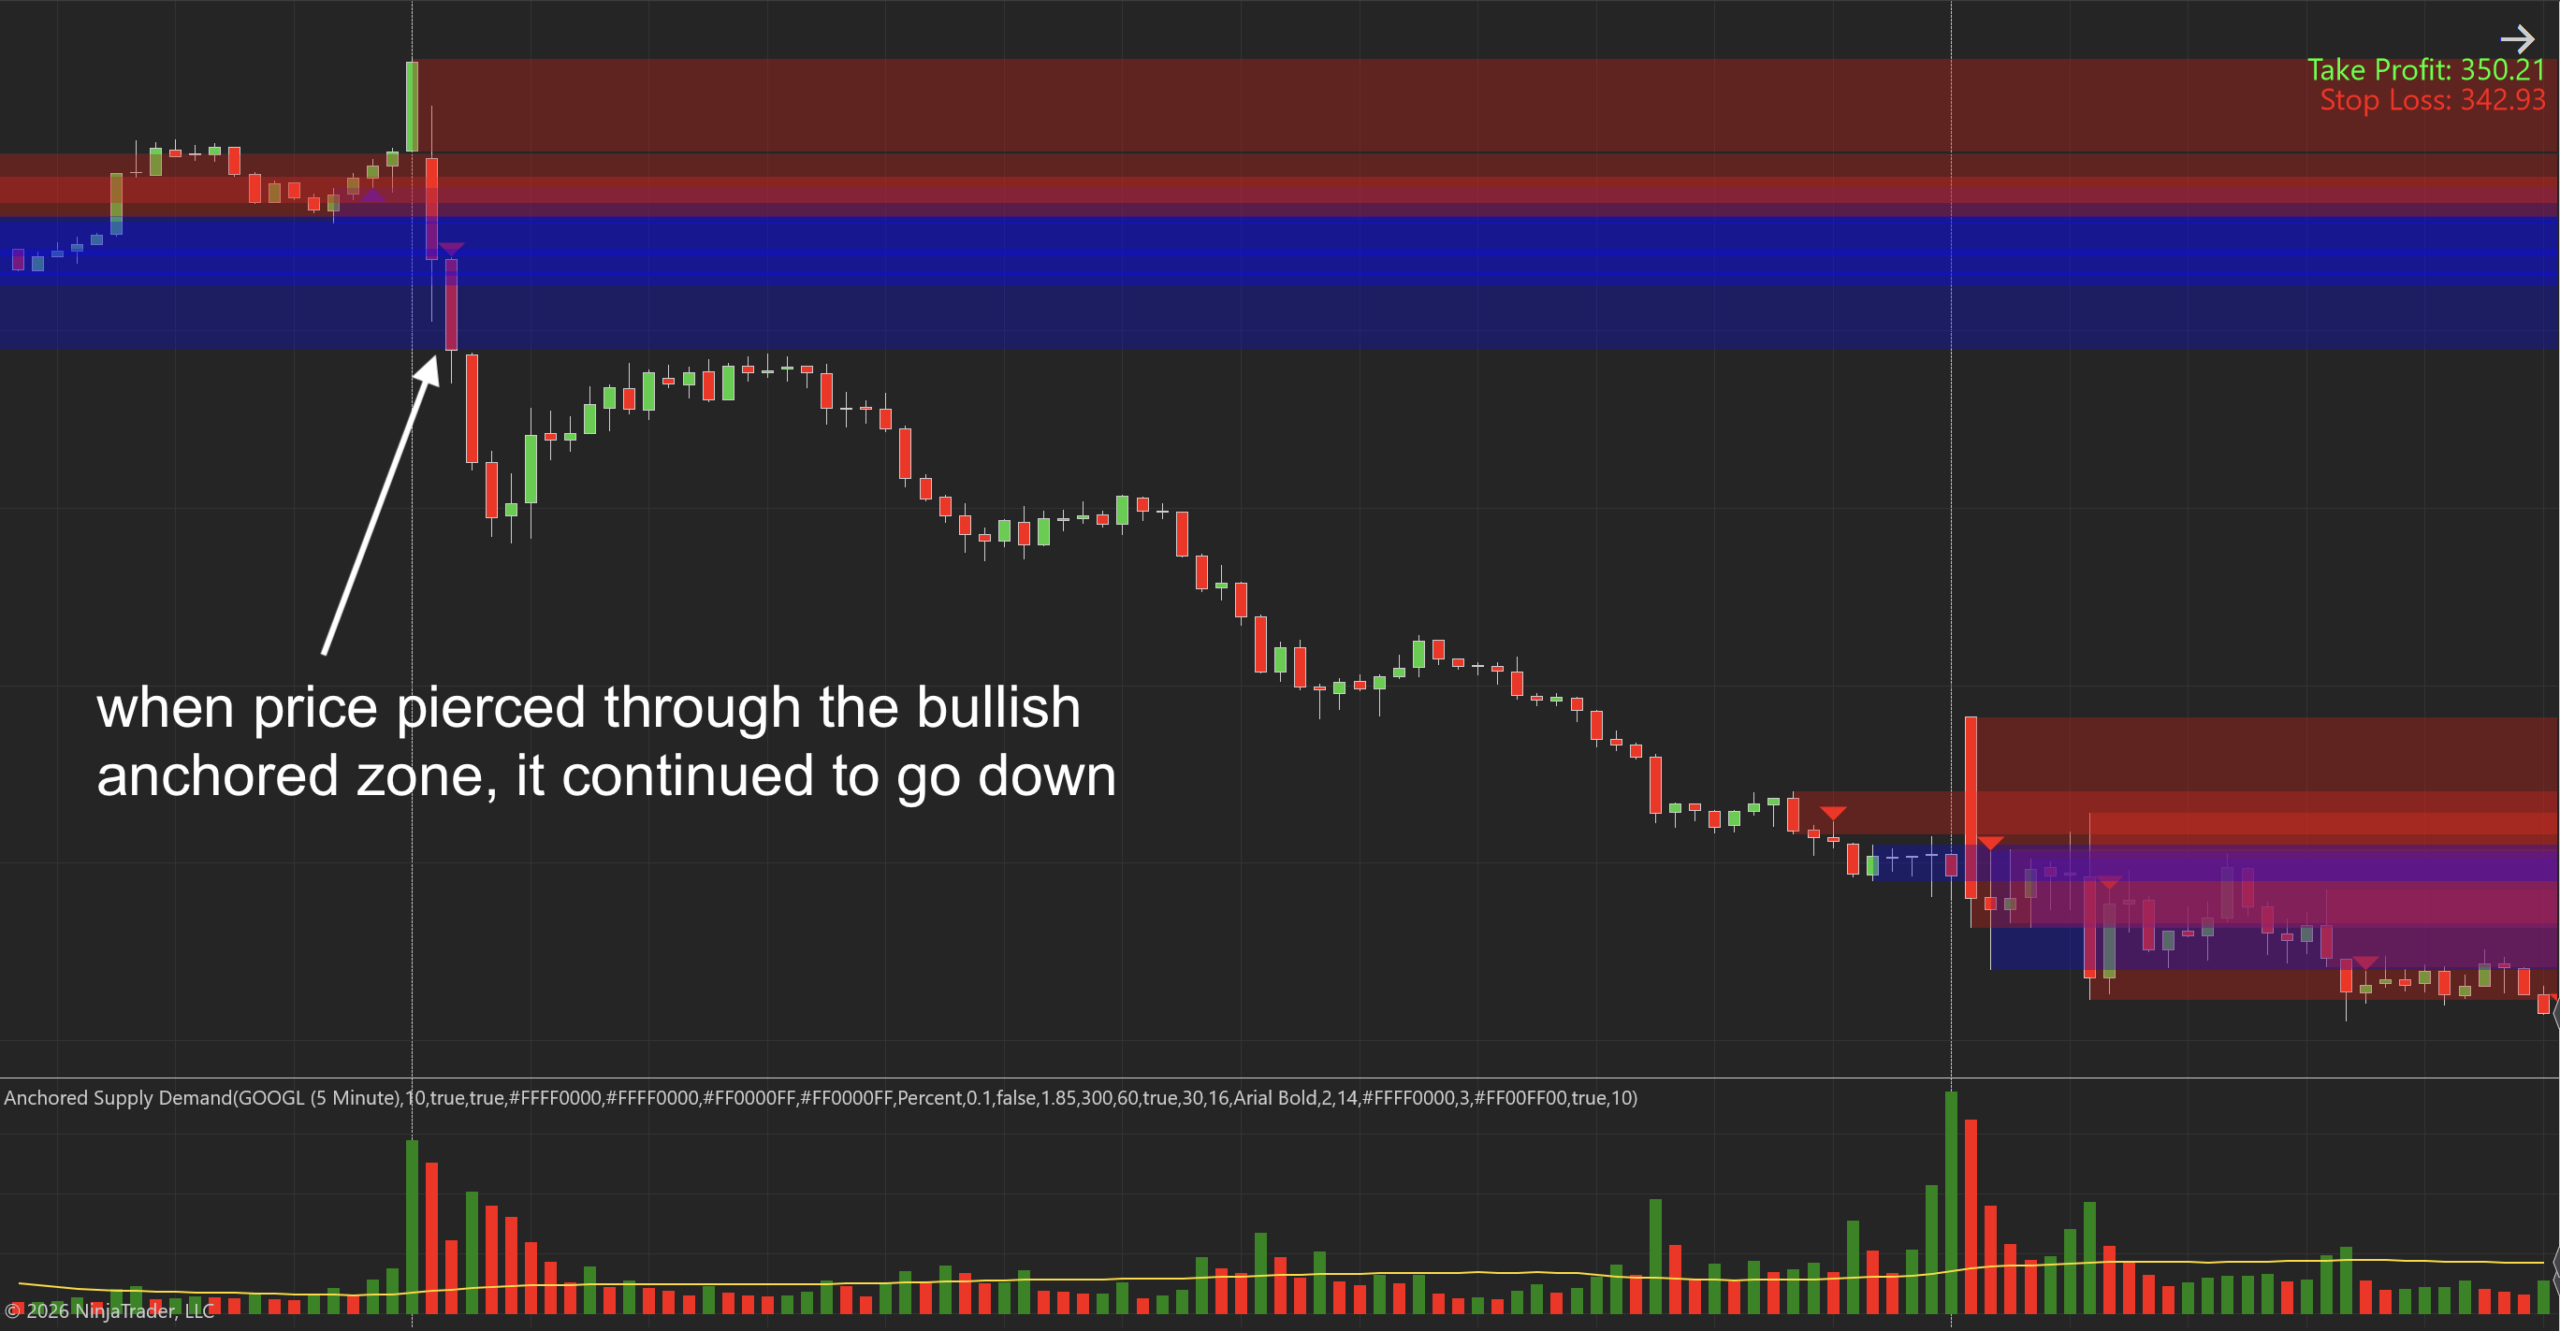
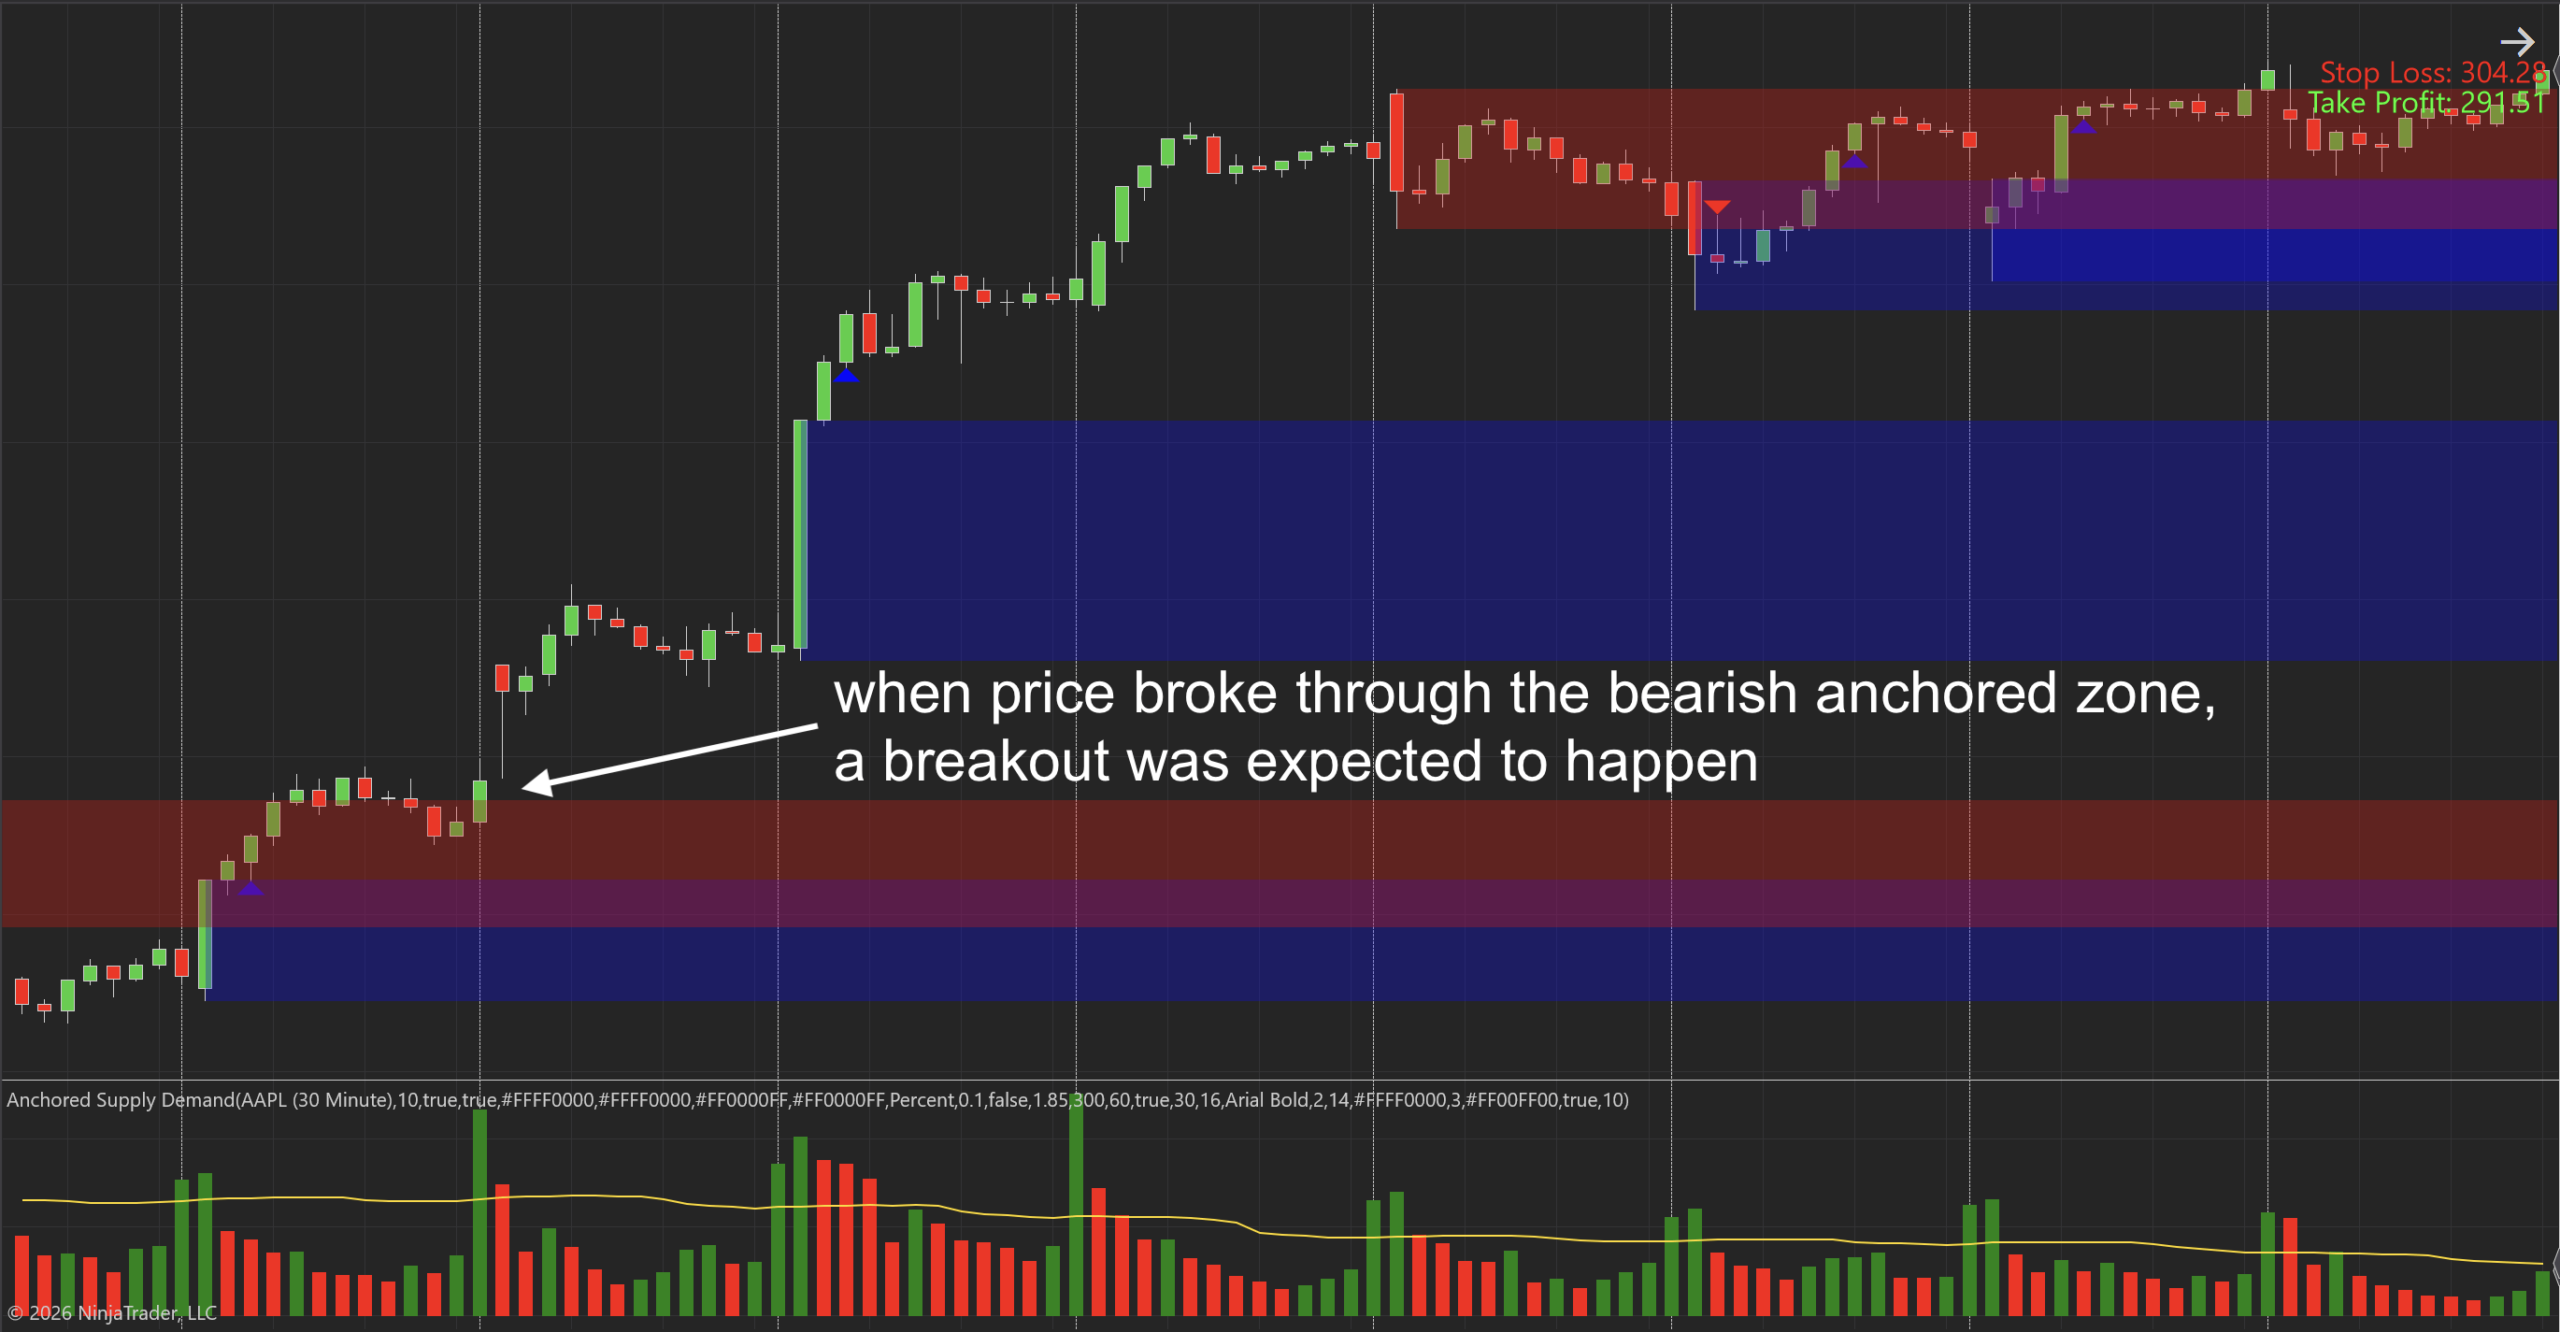
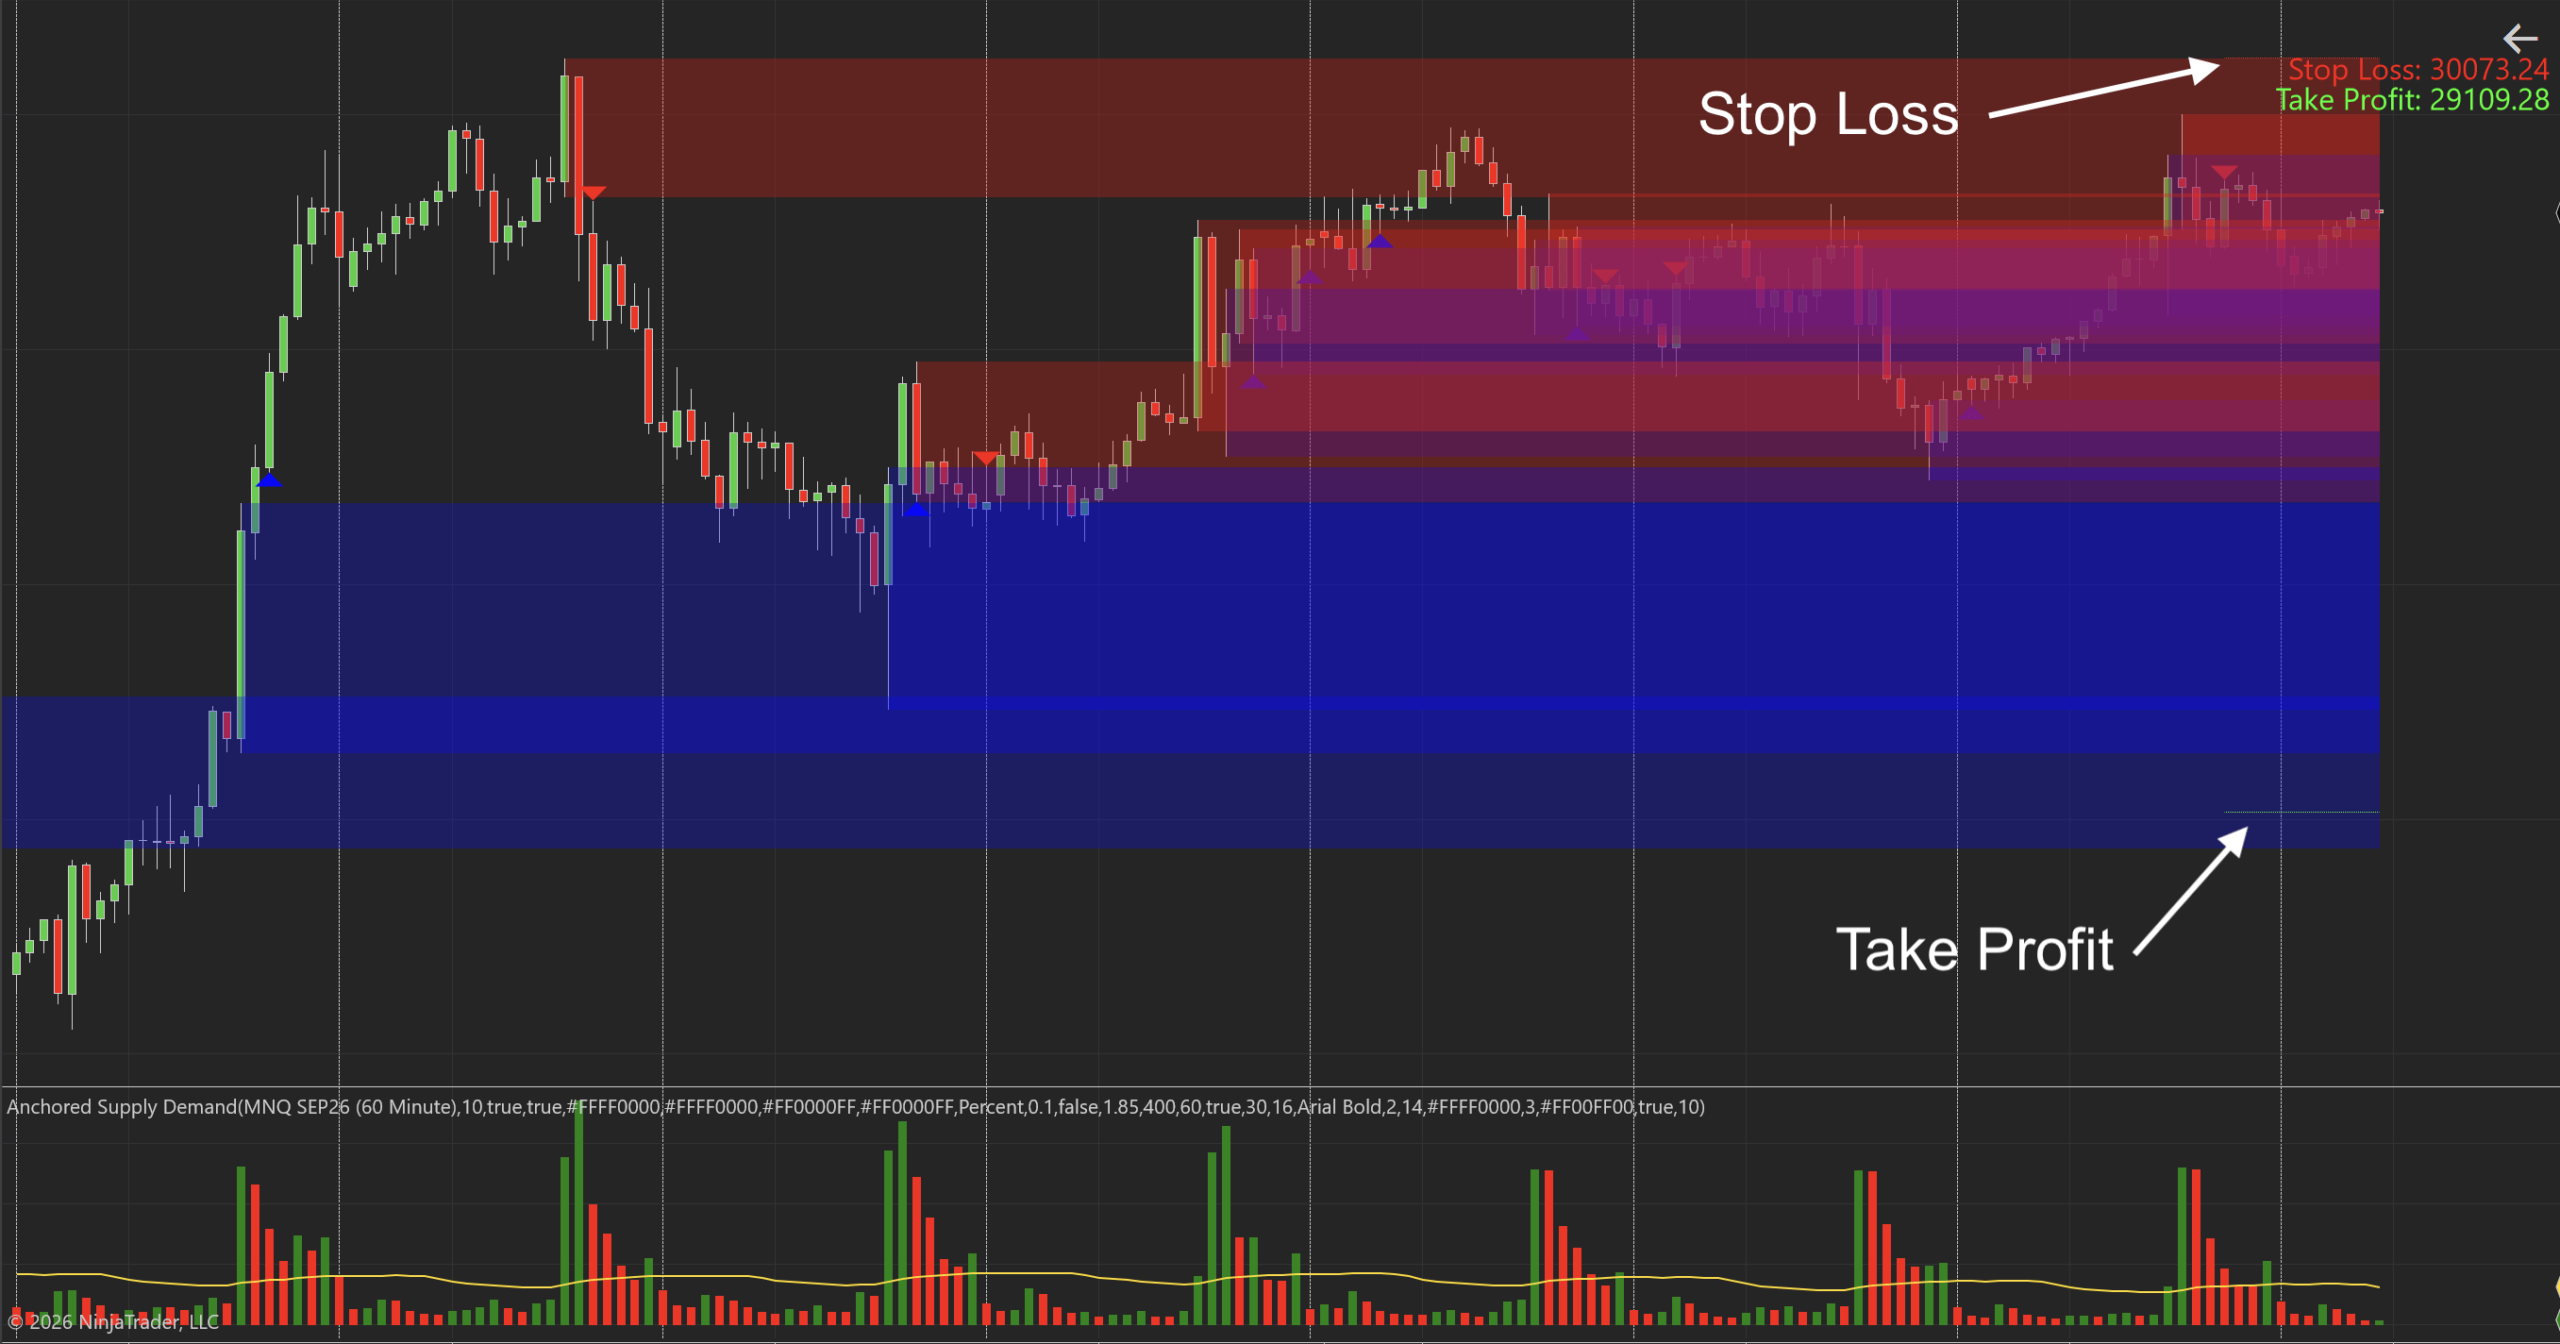
It’s called Anchored Supply Demand. Let me show you this amazing indicator in action. And then I’ll explain how it works.
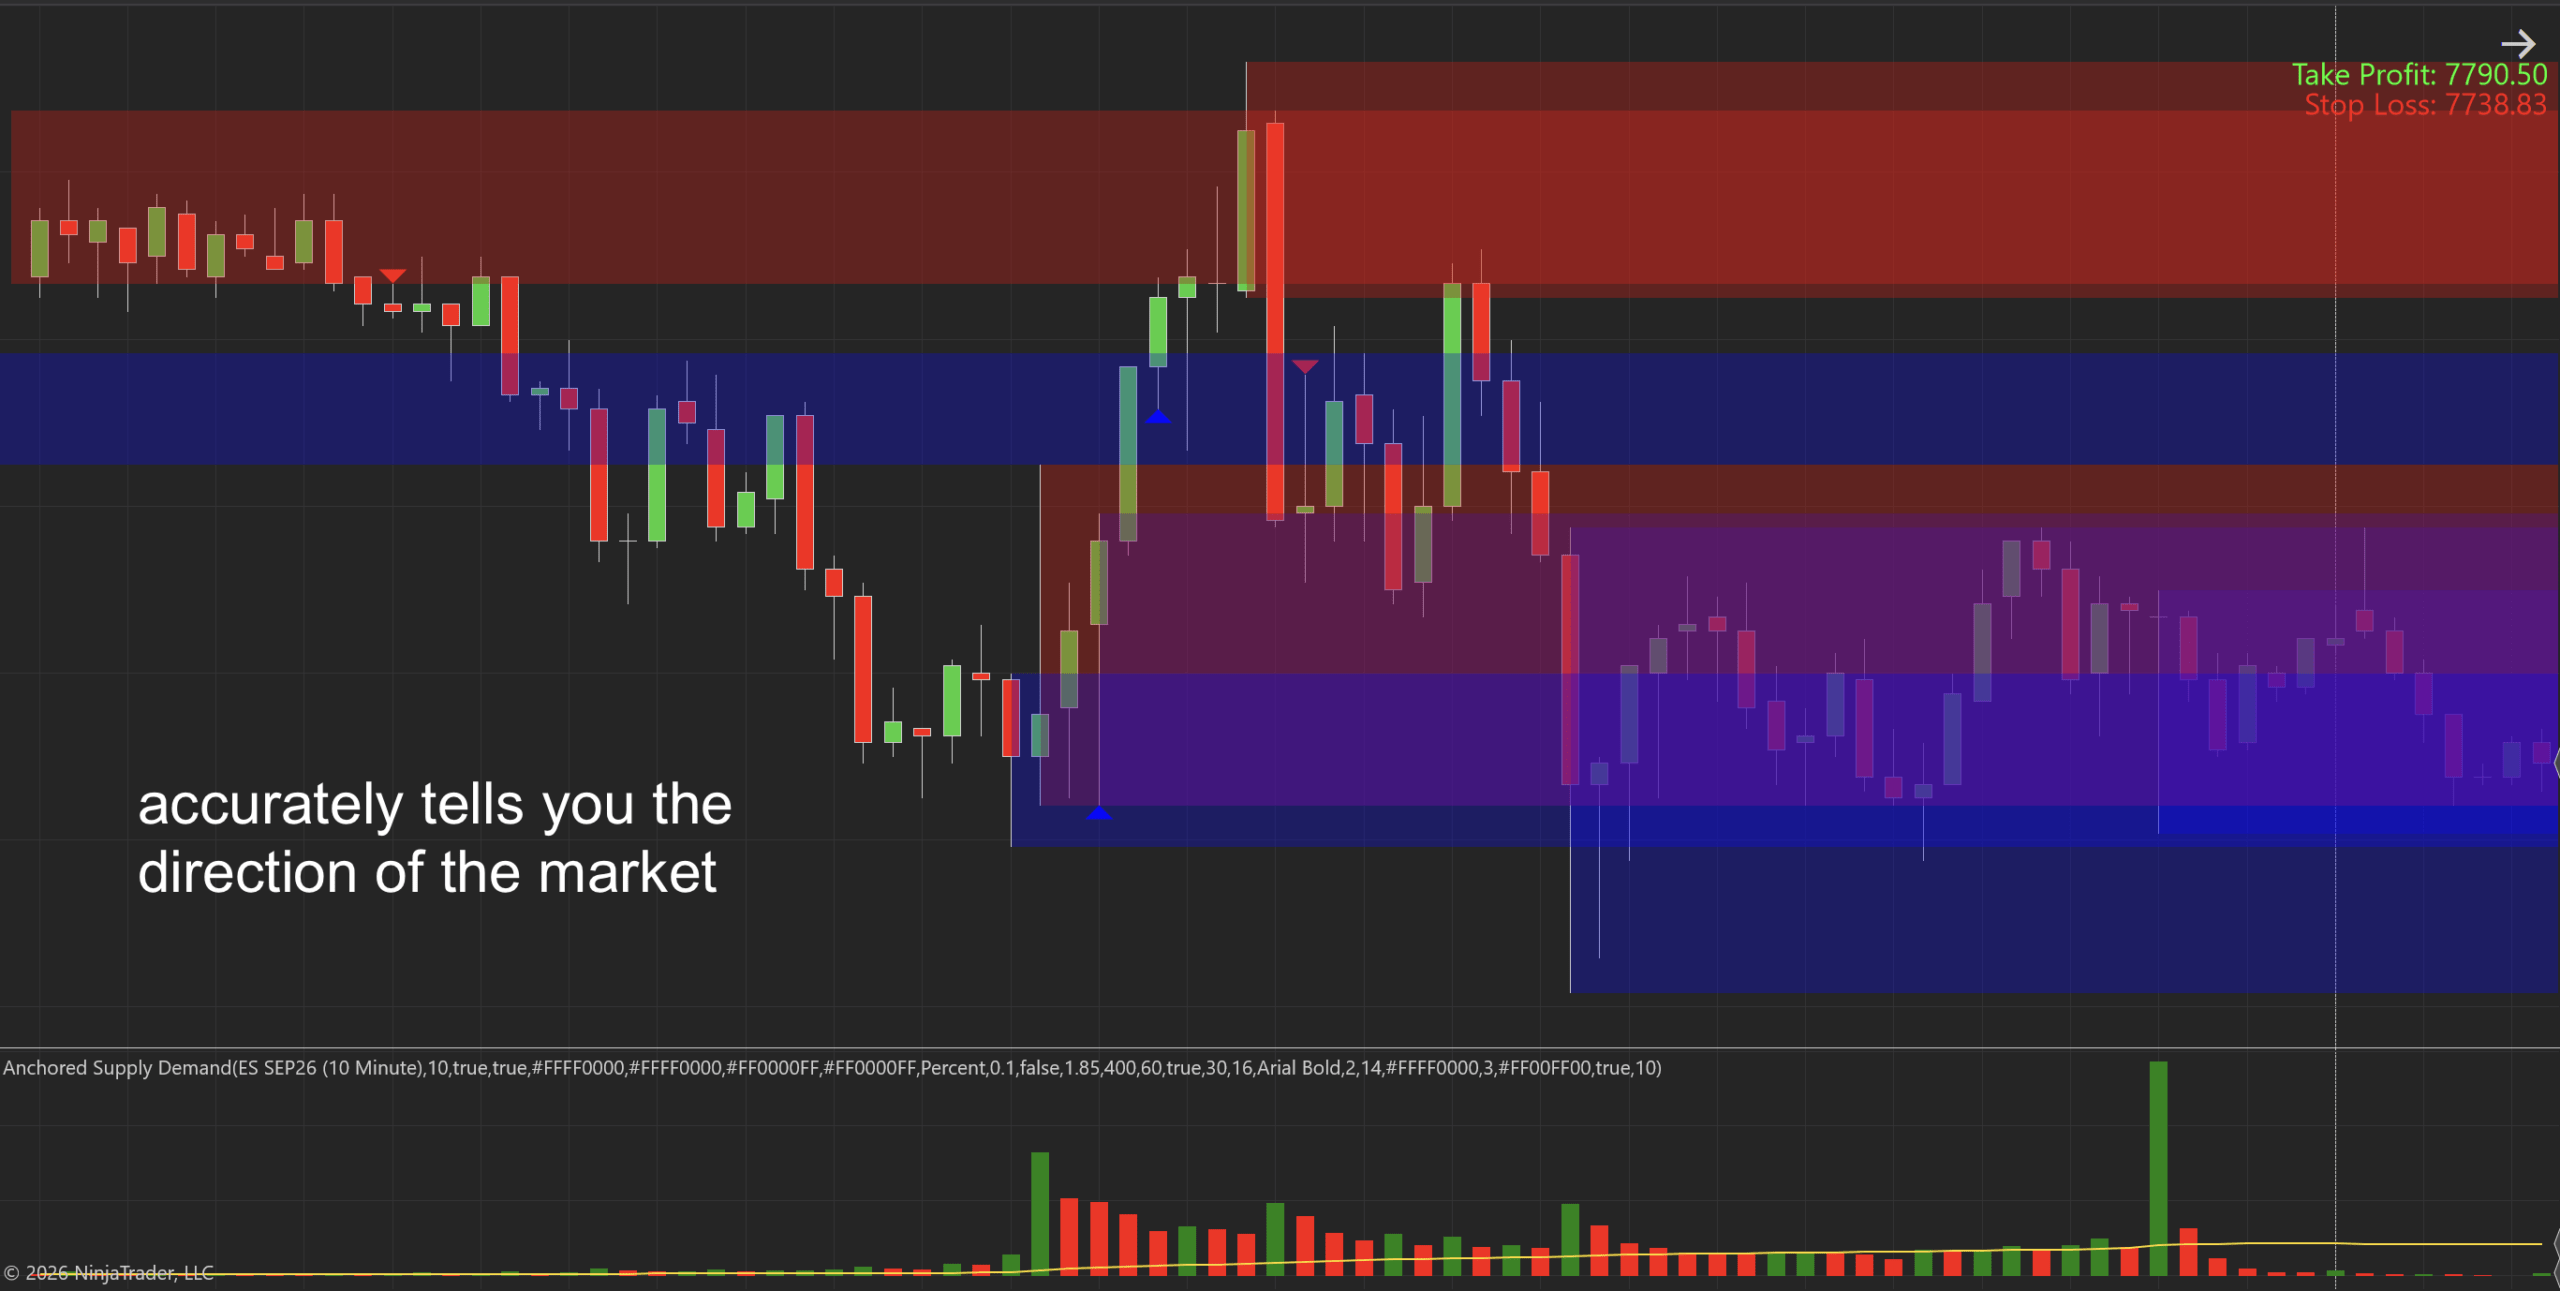
Pinpoints reversal opportunities through ‘anchored’ supply and demand zones
To accurately anticipate market reversals, this indicator detects supply and demand zones on the chart driven by market excitement.
These zones are strategically located using swing highs and lows as reference points, while assessing excitement levels indicated by volume and price range (or price spread). High-excitement zones are marked as anchored supply and demand zones.
The indicator then undergoes another critical phase of price action analysis within these zones to pinpoint exact reversal points.
Let’s see it in action…
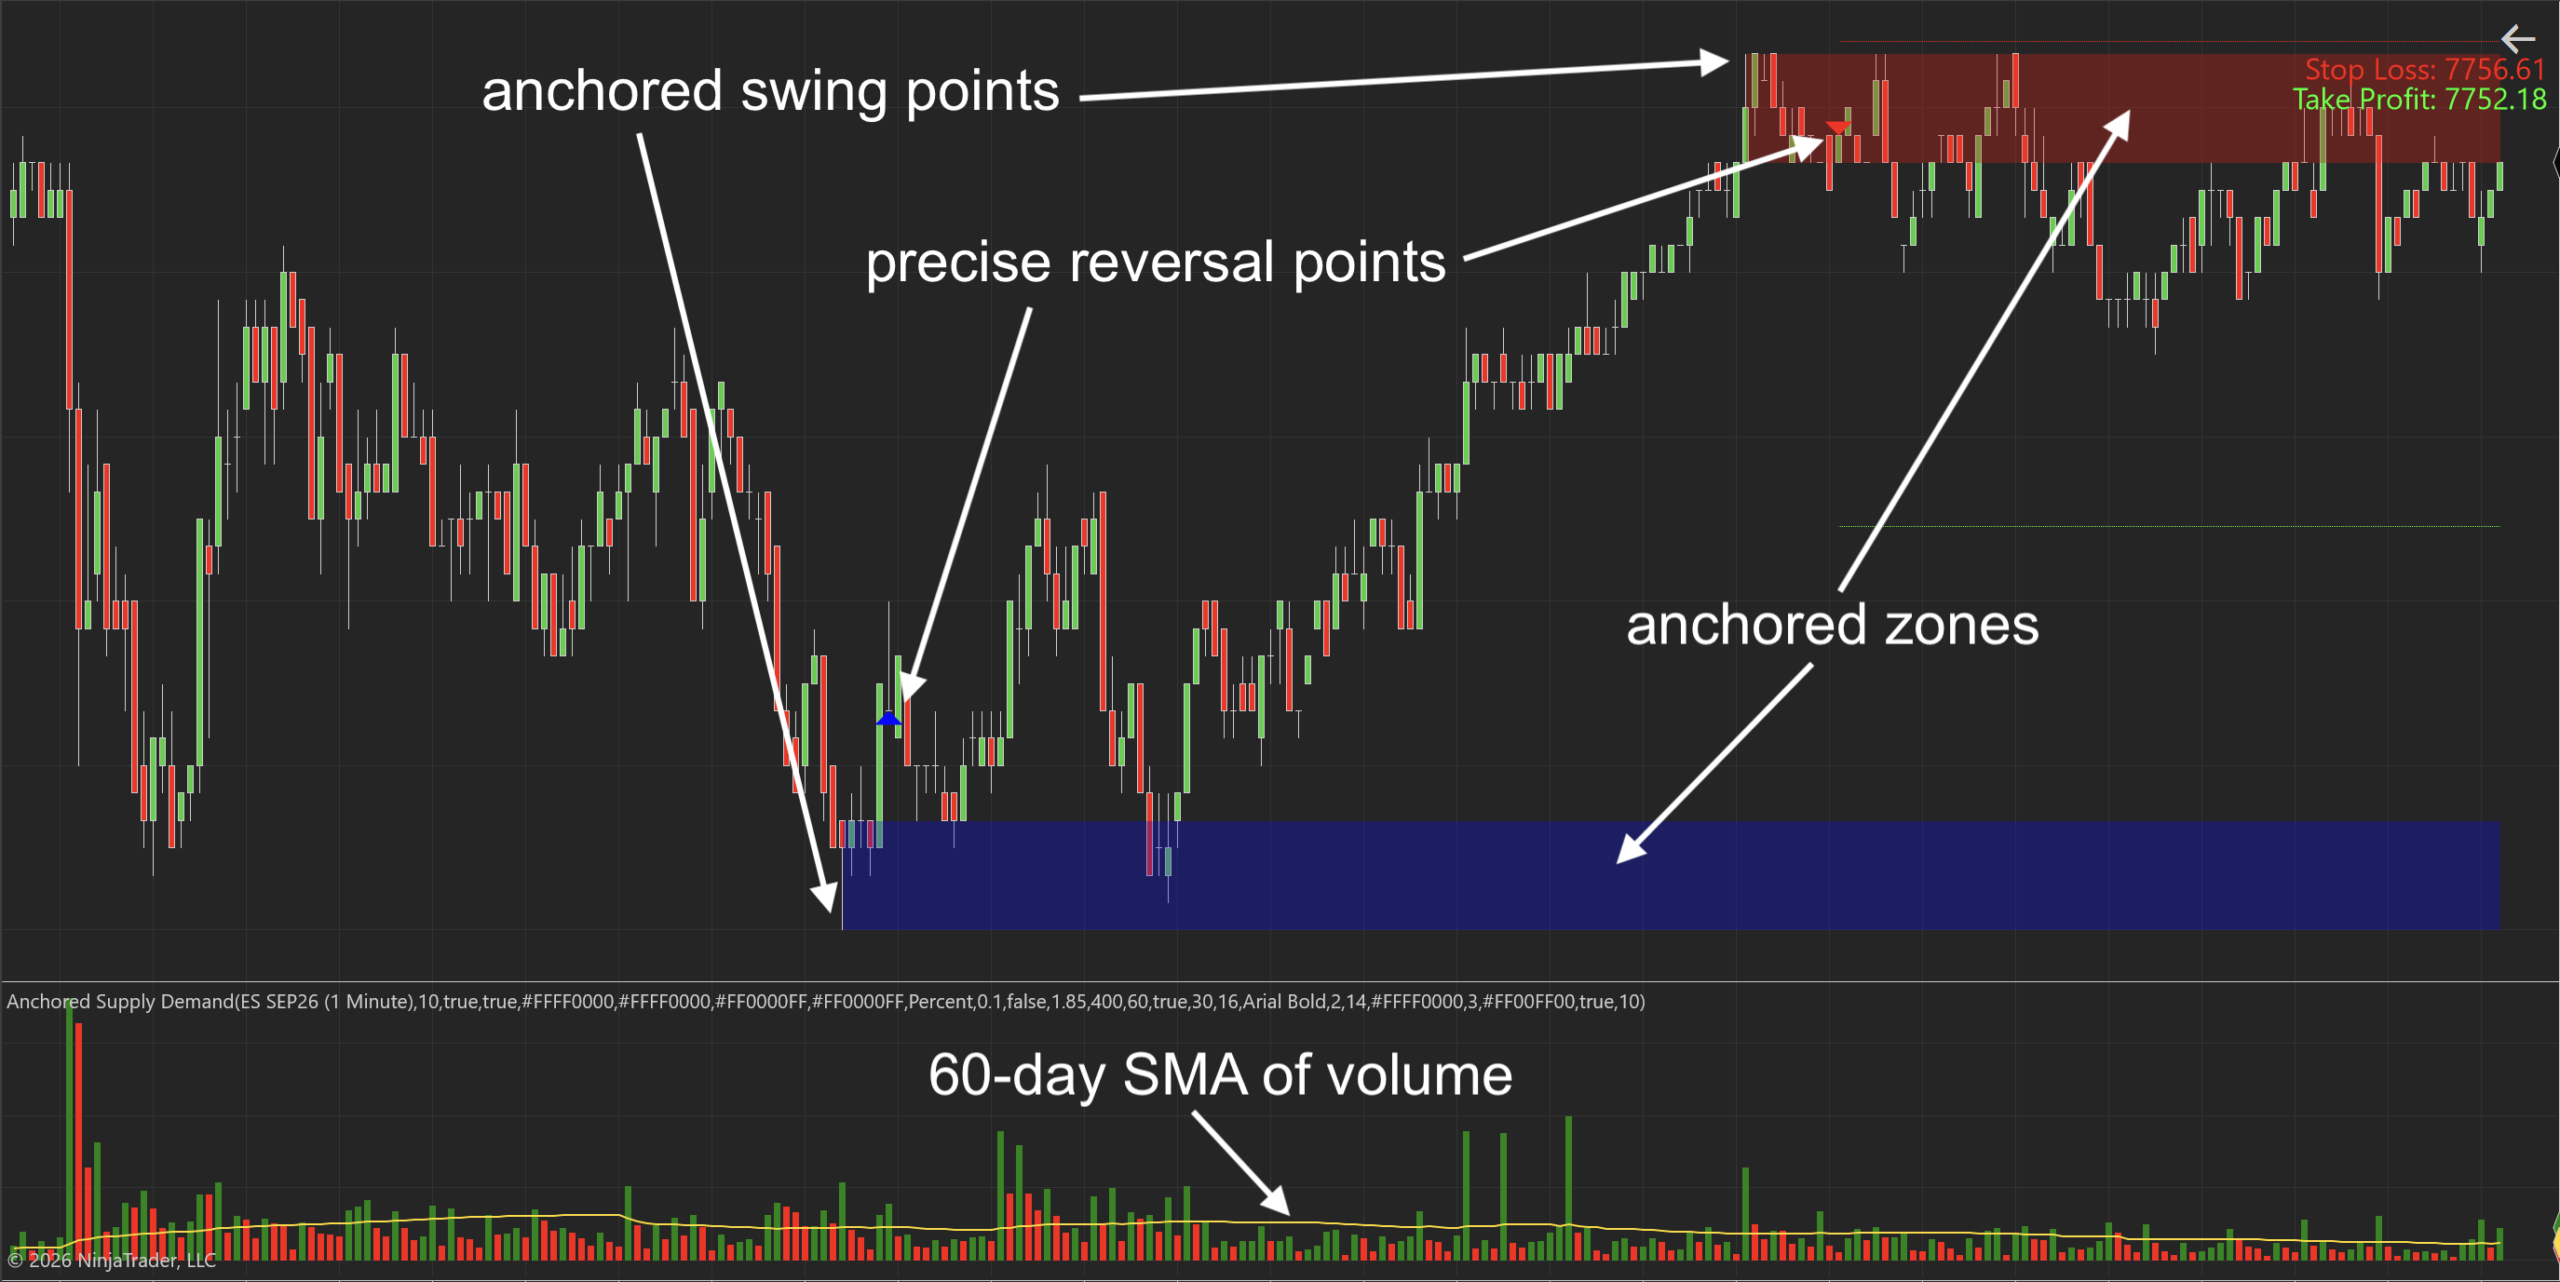
Leverages an advanced algorithm that incorporates volume and swing point price range data to precisely predict reversal
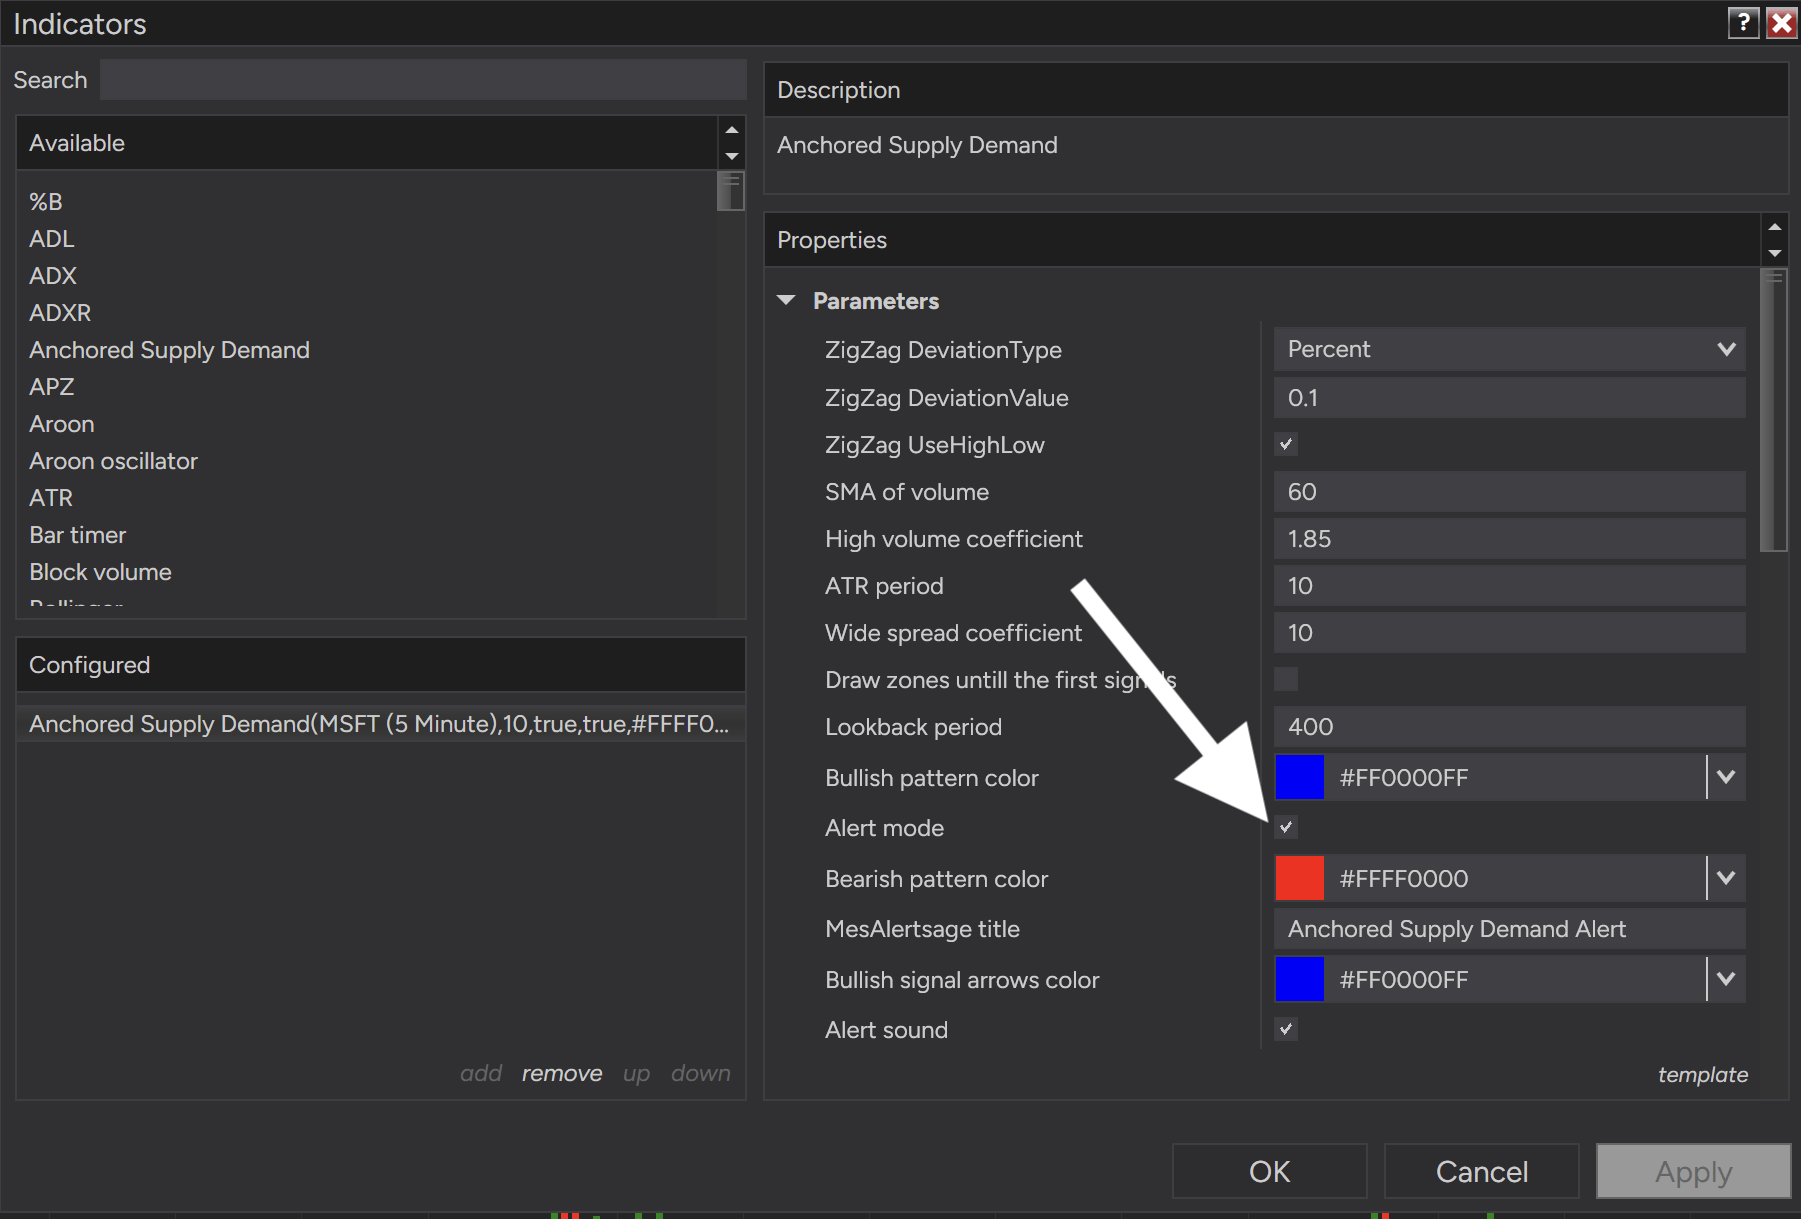
The indicator begins by identifying swing highs and lows through the Zigzag indicator. It then meticulously assesses volume levels at each swing point, designating them as anchored swing points when volume exceeds the 60-day SMA.
Following this, the indicator conducts a stringent verification process to confirm anchored candles, ensuring their price range surpasses the ATR by a default value.
Once a swing point meets both volume and price range criteria, an anchored zone is established. This zone is clearly delineated by drawing a rectangle around the anchored candle and extending it to the right.
Subsequently, the indicator conducts a comprehensive analysis of price movement within this anchored zone, offering remarkable reversal predictions.
Let’s have a look at how powerful the indicator is…